Opis
🚀 Ponad 10 000 traderów już korzysta z naszych NAJLEPSZYCH wskaźników🏆
Dowiedz się, dlaczego profesjonaliści wybierają nas – najpotężniejsze narzędzia na cTrader (wskaźniki, algorytmy i cBoty) czekają na Ciebie.
👉 Pobierz wszystkie nasze NAJLEPSZE systemy tutaj:
_______________________________________________
_______________________________________________
📌 Wskaźniki Struktury Rynku
· ✅ AdvancedMarket Structure: Bos, Choch, SwinLevels, Order Blocks, Market Structure& Liquidity Finder
· 🔄 Dynamic Market StructureAnalysis of Turning Points
· 🧱 Order Block
· ⚖️ Market Imbalance
· ⛓️ BOS & CHOCH
· 🧠 ICT Power of 3
______________________________________________________________-
Sklep cBotów : 🧠 Gold & BTC BreakoutSession Pivots 🧠
_______________________________________________
🔚 Inteligentne Systemy Wyjścia
_______________________________________________
📐 Wskaźniki ZigZag
· 🔍 ZigZag Price LiquidityProjection
· ➖ ZigZag
_______________________________________________
🧱 Wskaźniki Wsparcia i Oporu
· 🟩 SmartTrend Support &Resistance Lines
· 🧱 All Support and ResistanceLevels
_______________________________________________
📊 Wskaźniki Trendu i Kanału
· 📊 Supertrend
_______________________________________________
💧 Narzędzia Wolumenu i Płynności
_______________________________________________
⚡ Wskaźniki Momentum i RSI
· 🔎 Multi-Level Candle BiasTracker
_______________________________________________
🔮 Narzędzia Predykcji i Projekcji
· 📐 Prediction Based on Linreg& ATR
· 📏 Fibonacci Linear RegressionMulti-timeframe
· 📈 Volume-Powered Market Flow Projector
_________________________________________________________________________________
_________________________________________________________________________________
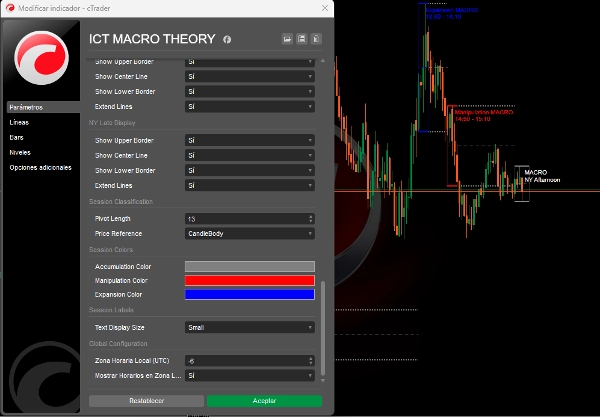
🌐 ICT MACRO THEORY
⚠️ WAŻNA UWAGA: Ten wskaźnik działa tylko na interwałach poniżej 5 minut.
Wyjaśnienie okresów ICT Macro
Okresy makro ICT to zasadniczo krótkie przedziały czasu, podczas których algorytm poszukuje płynności lub dostosowuje cenę do luk wartości godziwej. Podstawą tych makr ICT jest teoria czasu i ceny ICT.
Makro to "krótka seria instrukcji tworząca zdarzenie w dostawie ceny", jak definiuje to sam ICT.
Makra ICT nie są kompletnymi strategiami handlowymi, ale mogą dodać konfluencję do Twoich transakcji i zmaksymalizować zyski. Występują podczas sesji londyńskiej, nowojorskiej, południowej i popołudniowej.
🔮 Zaawansowana implementacja teorii czasów makro ICT:
Bezpośrednie powiązanie z koncepcjami ICT:
Kod implementuje dokładnie 3 typy makr ICT opisane w teorii, wykorzystując logikę klasyfikacji opartą na:
- Analizie struktury rynku:
-
- Wykrywaniu sesji makro
- Rejestruje dokładne czasy ICT (Londyn 02:33, NY 09:50, itd.).
- Wykrywa zmiany strukturalne przed i podczas każdej sesji makro.
- Automatycznie klasyfikuje na:
-
- 🟥 Manipulacja: Gdy cena zamiata płynność po obu stronach (kupno/sprzedaż).
- 🟦 Ekspansja: Ruchy kierunkowe zabierające płynność po jednej stronie (zgodnie z trendem).
- 🟩 Akumulacja: Wąski zakres, gdzie cena "akumuluje" płynność.
- Rozszerzone kluczowe poziomy:
-
- Rysuje maksima/minima każdej sesji makro.
- Oblicza i rozszerza średnią cenę (punkt środkowy) na kolejną sesję.
- Te poziomy działają jako dynamiczne wsparcie/opór (niezbędne w ICT!).
- Wykrywanie płynności w czasie rzeczywistym:
-
- Używa danych 1-minutowych do identyfikacji dokładnych punktów zwrotnych (takich samych jak na niższych interwałach).
Nadchodzące ulepszenia i aktualizacje:
- Wykrywanie zamiataczy płynności: Będzie identyfikować poprzednie zamiatacze płynności (maksima/minima poprzedniego dnia/tygodnia).
- Luki wartości godziwej (FVG): Będzie wykrywać i wizualizować luki wartości godziwej.
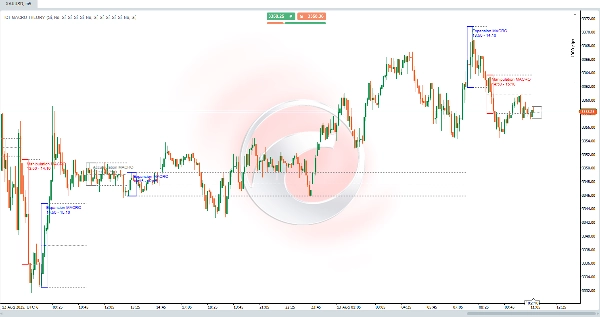
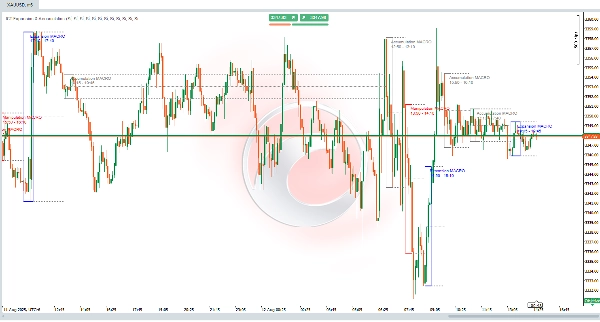
📊 Praktyczny przykład ICT
Scenariusz otwarcia NY (09:50-10:10):
- Przed sesją: Cena zamiata płynność po stronie kupna (lokalne minimum).
- Podczas sesji:
-
- Zaklasyfikowane jako 🟥 MANIPULACJA.
- Cena przechodzi do struktury niedźwiedziej.
- Po sesji:
-
- Rozszerzone linie oznaczają opór na maksimach sesji.
- Odrzucenie transakcji w strefie z RR 1:3.
✅ Wierny zasadzie ICT:
"Makra nie są kompletnymi strategiami, ale dodają konfluencję poprzez identyfikację miejsc, gdzie algorytmy będą poszukiwać płynności."
Podsumowanie
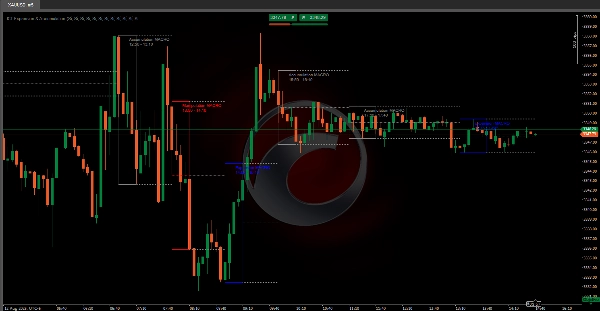
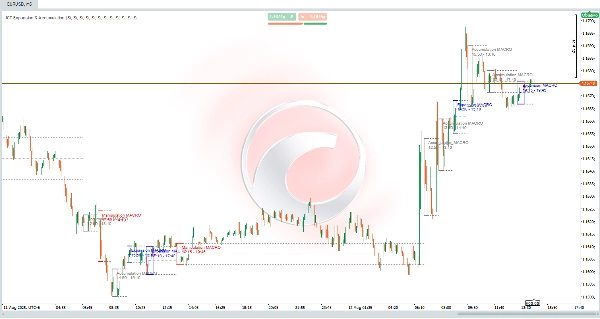
The indicator analyzes market structure and detects key macro sessions—London, New York, midday, and afternoon—recording exact ICT times. It classifies price behavior into three types of macros: Manipulation (price sweeps liquidity on both sides), Expansion (directional movement aligned with trend), and Accumulation (tight range where price accumulates liquidity). It also draws and extends session highs, lows, and average price levels to act as dynamic support and resistance.
Using 1-minute data, ICT MACRO THEORY detects precise pivots for real-time liquidity identification. While not a complete trading strategy, it adds confluence to trades by highlighting where algorithms seek liquidity. Planned updates include detection of liquidity sweeps and visualization of fair value gaps.
This tool is intended for traders seeking to incorporate ICT macro time concepts into their analysis for enhanced market structure insight and liquidity detection on very short timeframes.