
الوصف
مؤشر خروج وإعادة دخول القفزة السعرية (PjER) هو مؤشر لإدارة المخاطر يعتمد على الورقة الأكاديمية "استراتيجية ديناميكية لخروج وإعادة دخول القفزات السعرية للتداول اليومي" من تأليف Koegelenberg & van Vuuren (2024)، نُشرت في مجلة Expert Systems With Applications.
الابتكار الرئيسي
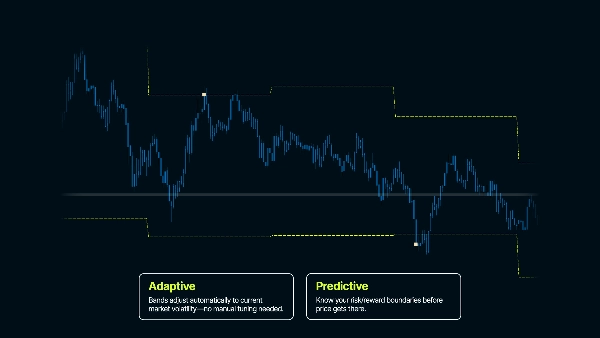
- تقديرات قيمة المخاطرة (VaR) للخسائر المحتملة قبل حدوثها
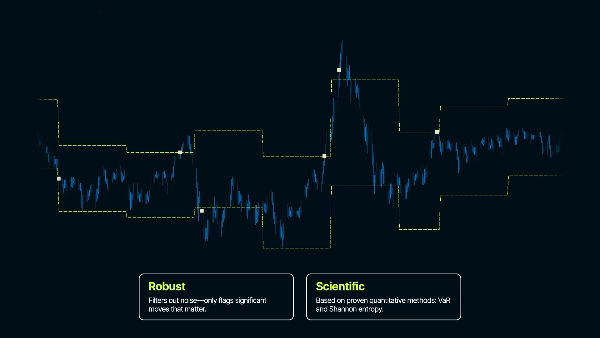
- الصلابة ضد الاتجاهات السوقية القوية على أطر زمنية قصيرة
- تحليل تصحيح السوق بعد القفزة لتوقيت إعادة الدخول الآمن
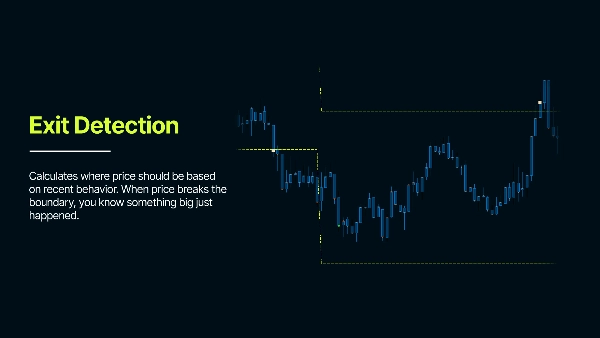
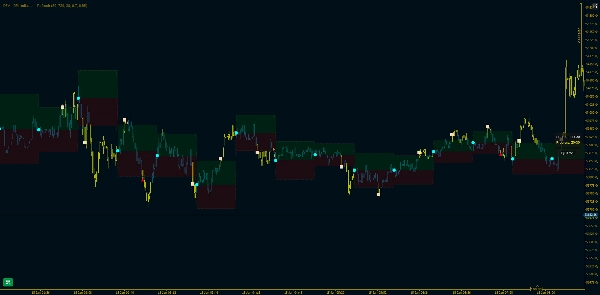
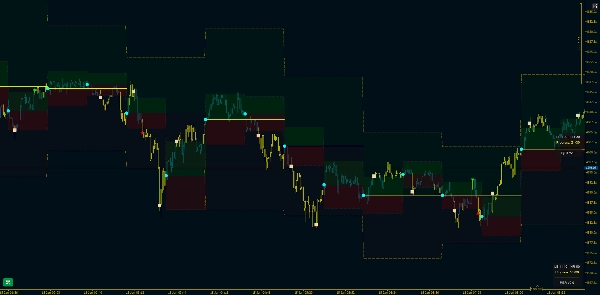
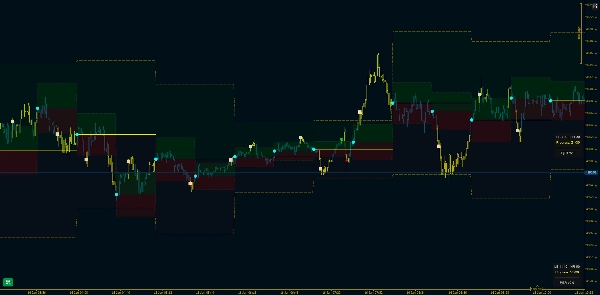
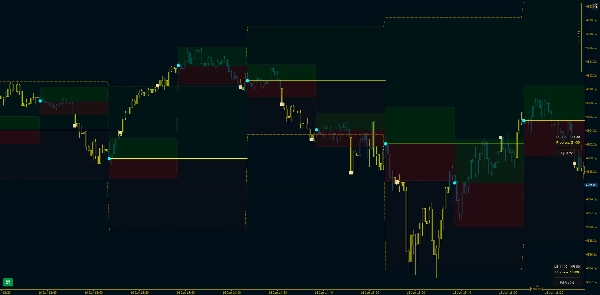
يقوم بتحليل تحركات الأسعار السابقة لفهم التقلبات النموذجية ويُنشئ فترات ثقة - تمثل نطاق السعر المتوقع. عندما يقفز السعر خارج هذه الحدود، يشير ذلك إلى حدوث شيء غير طبيعي.
حالة الاستخدام المستهدفة
التداول اليومي (خاصة الاستراتيجيات القائمة على النطاق). ينشئ هذا المؤشر حدودًا إحصائية حول السعر لاكتشاف تحركات سعرية غير طبيعية. في السلوك السوقي الطبيعي، يبقى السعر ضمن النطاقات المتوقعة بناءً على التقلبات الأخيرة. عندما يكسر السعر هذه الحدود، يشير ذلك إلى حدوث شيء غير معتاد - نقطة خروج محتملة من الصفقة أو اختراق في هيكل السوق، لأن سلوك السوق قد تغير.
شرح المعلمات الأساسية
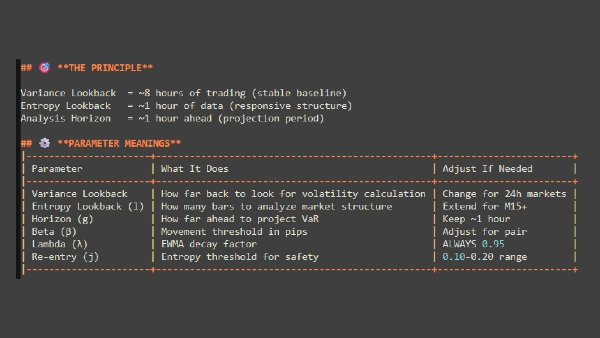
أقصى عدد أيام للوراء - يحدد مدى الرجوع في التاريخ الذي يبدأ فيه المؤشر العمل
تعويض توقيت جرينتش (GMT Offset) - يضبط حسب منطقتك الزمنية. يضمن تطابق حسابات التاريخ مع وقتك المحلي
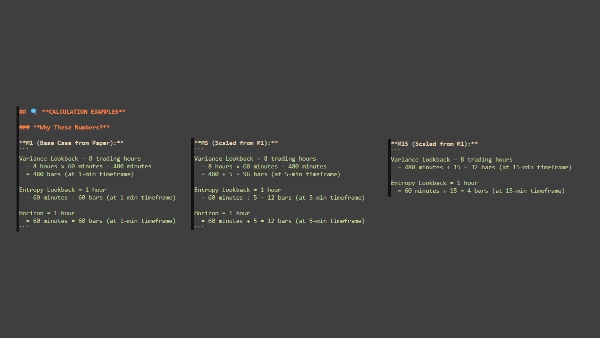
فترة الرجوع (عدد الأشرطة)
"كم من تاريخ السعر يجب أن أستخدم لقياس السلوك 'الطبيعي'؟"
- كم عدد أشرطة البيانات التاريخية التي تُستخدم لحساب التقلبات
- المزيد من الأشرطة = استقرار أكبر ولكن استجابة أبطأ؛ عدد أقل من الأشرطة = استجابة أسرع ولكن مع ضوضاء أكثر
- مثال: 1440 شريطًا على M1 = 24 ساعة من البيانات
أفق التحليل (عدد الأشرطة)
"كم من الوقت يجب أن أراقب السعر قبل البدء من جديد؟"
- مدة كل فترة تحليل قبل إعادة تعيين الحدود
- يحدد الإطار الزمني الذي تحلله - الأقصر = إعادة تعيين أكثر تكرارًا، الأطول = تبقى الحدود ثابتة لفترة أطول
- مثال: 60 شريطًا = تبقى الحدود لمدة 60 شريطًا، ثم تعاد الحسابات من سعر مرجعي جديد
احتمالية المخاطرة
"ما مدى التأكد الذي أريده بأن السعر لن يصل عادة إلى هذه المستويات؟"
- يحدد مستوى الثقة للحدود (مثل هامش الأمان)
- القيم الأعلى = حدود أوسع (إشارات أقل)، القيم الأدنى = حدود أضيق (إشارات أكثر)
- مثال: 0.80 = ثقة 80% بأن السعر يبقى ضمن الحدود في الظروف الطبيعية
عامل التلاشي (λ - لامبدا)
"هل يجب أن أهتم أكثر بما حدث للتو أم أعامل كل التاريخ على قدم المساواة؟"
- يتحكم في مقدار الوزن المعطى للبيانات الحديثة مقابل البيانات القديمة في حسابات التقلب
- القيم الأعلى = البيانات الحديثة تهم أكثر؛ القيم الأدنى = كل البيانات موزونة بشكل متساوٍ أكثر
- مثال 0.95 = التقلب الحديث يؤثر بشدة على الحساب
نقاط رئيسية يجب تذكرها
هذه أداة لإدارة المخاطر – تحدد أحداث التقلب والاستقرار على مدى فترات زمنية
فترات الثقة حاسمة – يجب ألا تتبع الحدود السعر مثل ATR – يتم حساب الحدود لكل فترة تحليل
إعادة الدخول تتطلب الصبر – لا تتوقع إعادة دخول فورية بعد الخروج – يحتاج السوق إلى وقت للاستقرار
المعلمات خاصة بالأصل والإطار الزمني – المعلمات الافتراضية هي نقاط بداية – قم بتحسينها لسوقك وأسلوبك الخاص – ما يعمل في الفوركس قد لا يعمل في المؤشرات أو المعادن أو العملات الرقمية.
( * ) يتم توفير هذا المؤشر لأغراض تعليمية ومعلوماتية فقط. لا يُقصد به أن يكون نصيحة مالية أو استثمارية. لا ينبغي تفسير أي شيء في هذا المنتج أو وثائقه أو أي مواد ذات صلة على أنه توصية بالشراء أو البيع أو الاحتفاظ بأي أداة مالية. التداول في الأسواق المالية ينطوي على مخاطر كبيرة وقد لا يكون مناسبًا لجميع المستثمرين. الأداء السابق لا يدل على النتائج المستقبلية. لا يوجد ضمان للأرباح، وقد يتكبد المستخدمون خسائر كبيرة. باستخدام هذا المؤشر، فإنك تقر بأنك المسؤول الوحيد عن قرارات التداول والنتائج المالية الخاصة بك. لا يتحمل منشئ هذا المنتج أي مسؤولية عن أي خسائر أو أضرار تنشأ مباشرة أو غير مباشرة من استخدامه. قم دائمًا بإجراء تحليلك الخاص قبل اتخاذ أي قرارات تداول.
الملخص
Key features include Value at Risk (VaR) estimates to anticipate potential losses, robustness against strong short-term trends, and analysis of post-jump corrections to identify safe re-entry timings. Core adjustable parameters allow users to tailor the indicator to specific assets and timeframes, including lookback period for volatility calculation, analysis horizon for band recalculation frequency, risk probability to set confidence levels, and decay factor to weight recent versus older data.
The indicator emphasizes patience for re-entry after exits, as market stabilization is required. It is intended as a tool for identifying volatility events and managing risk rather than providing direct trade signals. Users should optimize parameters according to their trading style and market conditions.
تقييمات العملاء
5 | 100 % | |
4 | 0 % | |
3 | 0 % | |
2 | 0 % | |
1 | 0 % |


