🎯 INTELIGENCIA DE VOLATILIDAD MULTI-TIEMPO
Deja de perder rupturas de volatilidad - Ve todos los marcos temporales simultáneamente
La mayoría de los indicadores de volatilidad te muestran solo una perspectiva. Nuestro Indicador de Volatilidad Rodante Multi-Tiempo te ofrece la imagen completa a través de períodos a corto plazo (7), medio plazo (21) y largo plazo (63) - con señales de trading integradas que te indican exactamente cuándo actuar.
⚡ POR QUÉ LA VOLATILIDAD MULTI-TIEMPO LO CAMBIA TODO
Marco temporal único vs nuestro enfoque multi-tiempo:
- ❌ Periodo único: Ves los árboles pero no el bosque
- ✅ Tres periodos: Paisaje completo de volatilidad con contexto
Escenarios reales de trading:
- Pico a corto plazo mientras calma a largo plazo → Ruido temporal (ignorar)
- Todos los marcos temporales en alza → Cambio genuino de régimen (actuar)
- Calma a corto plazo en medio del caos a largo plazo → Falsa calma (precaución)
🎯 CARACTERÍSTICAS PROFESIONALES
✨ VISIBILIDAD TRIPLE DE MARCOS TEMPORALES
- StdDev 7: Captura cambios inmediatos de volatilidad (intradiario)
- StdDev 21: Volatilidad a medio plazo (swing trading)
- StdDev 63: Contexto de volatilidad a largo plazo (trading de posición)
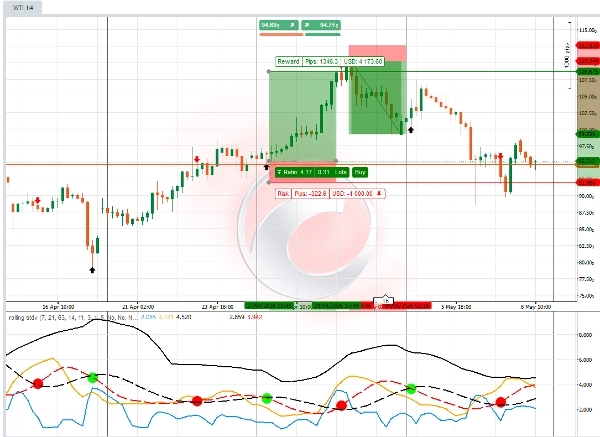
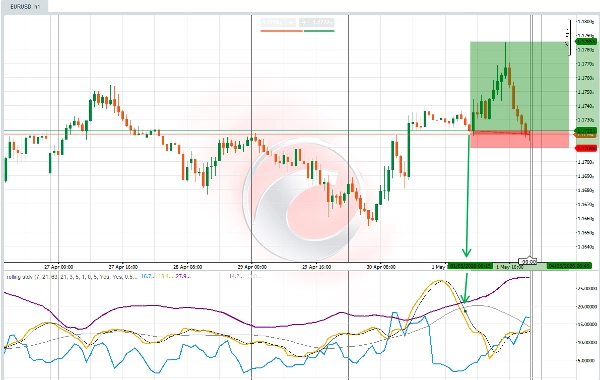
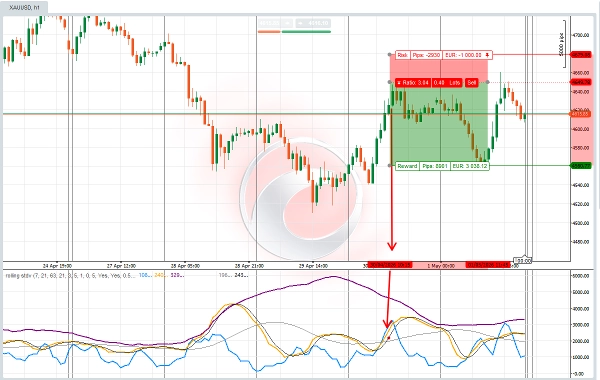
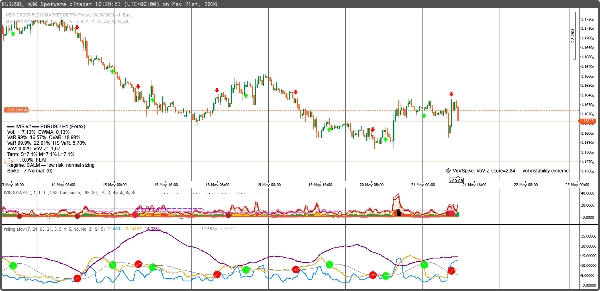
- Señal del oscilador: cuando las líneas de señal promedio de la desviación estándar rodante se cruzan, los puntos coloreados confirman mayor y menor volatilidad y la dirección de la acción del precio. Con una señal de PUNTO Rojo, PUNTO Verde, el Trader también verá una señal de Flecha Roja, Flecha Verde en el gráfico, que puede ayudar a decidir los niveles de entrada y el tamaño de la operación.
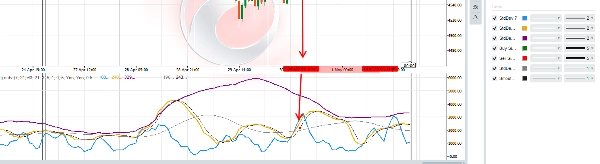
- La desviación estándar rodante es un oscilador de volatilidad con lógica de señal predictiva del mercado. Los parámetros en el panel deben revisarse y adaptarse al tipo de instrumento CFD que el trader desea operar. Cada instrumento CFD de activo financiero puede tener configuraciones ligeramente diferentes en el panel. Los traders pueden elegir la exactitud y precisión de las lecturas de volatilidad, activando: Pendiente, señal de cruce rápido/medio y suavizado.
📊 ANÁLISIS AVANZADO DE VOLATILIDAD
- Cruces de volatilidad: Cruce de líneas StdDev = cambios de régimen
- Señales de reversión a la media: Volatilidad regresando al promedio
- Detección de picos: Eventos de volatilidad extrema
💡 PERFECTO PARA ESTOS ESTILOS DE TRADING:
🎯 Traders de rupturas de volatilidad
- Entrar durante baja volatilidad antes de movimientos explosivos
- Salir durante alta volatilidad antes de reversiones
- Temporizar entradas con precisión usando triple confirmación
📈 Traders de reversión a la media
- Contrarrestar extremos de volatilidad con confianza
- Identificar condiciones de mercado sobreextendidas
- Usar la volatilidad como indicador contrario
🛡 Traders aversos al riesgo
- Evitar completamente períodos de alta volatilidad
- Operar solo durante mercados calmados y predecibles
- Usar la volatilidad como una guía para dimensionar posiciones
📊 Traders de opciones
- Venta de prima temporal durante alta volatilidad
- Comprar opciones durante compresión de volatilidad
- Análisis IV vs HV para detectar precios erróneos
Señales inteligentes integradas:
- ✅ Comprar cuando: La volatilidad cae por debajo del umbral O cruza por debajo del promedio móvil
- ✅ Vender cuando: La volatilidad se dispara por encima del umbral O cruza por encima del promedio móvil
📈 LO QUE OBTIENES:
✅ Visibilidad triple de marcos temporales - No más adivinar el contexto de volatilidad
✅ Señales automáticas de compra/venta - Flechas visuales claras en puntos óptimos
✅ Detección de régimen de volatilidad - Saber cuándo los mercados están calmados o caóticos
✅ Umbrales personalizables - Adaptarse a cualquier estilo de trading o activo
✅ Codificación de colores profesional - Comprensión visual instantánea
💰 PRECIO ESPECIAL DE LANZAMIENTO: $50
(Precio regular: $100)
Desglose del valor:
- Indicador StdDev 7: valor de $29
- Indicador StdDev 21: valor de $29
- Indicador StdDev 63: valor de $29
- Señales de trading: valor de $49
- Valor total: $136
- Tu precio: $50 (Ahorra 35%)
Incluido: Indicador completo de color
🎁 BONO: Guía gratuita de temporización de volatilidad
La compra incluye "Dominio de la volatilidad multi-tiempo" - un valor de $39 GRATIS.
Incluye:
- Estrategias de trading de compresión de volatilidad
- Técnicas de confirmación multi-tiempo
- Gestión de riesgo para períodos volátiles
- Ejemplos de operaciones reales
🚀 ¿LISTO PARA DOMINAR LA TEMPORIZACIÓN DE LA VOLATILIDAD?
Haz clic en "Agregar al carrito" y transforma cómo ves y operas la volatilidad del mercado.
"He probado todos los indicadores de volatilidad que existen. Este enfoque triple de marcos temporales con señales integradas es lo que uso diariamente en mi trading de firma propietaria."
- Sarah Rodriguez, Trader profesional de swing
PERFECTO PARA ESTOS MERCADOS:
📊 Acciones y ETFs
- Temporización de volatilidad SPY, QQQ
- Rotación sectorial basada en volatilidad
- Operaciones de volatilidad en ganancias
💹 Pares de Forex
- Análisis de volatilidad de pares principales
- Evaluación de riesgo en carry trade
- Confirmación de rupturas
📈 Materias primas
- Ciclos de volatilidad del oro
- Picos de volatilidad del petróleo
- Volatilidad estacional agrícola
🔄 Criptomonedas
- Regímenes de volatilidad BTC/ETH
- Oportunidades de volatilidad en altcoins
- Gestión de riesgo en cripto
Conclusión: Esto no es solo otro indicador de desviación estándar. Es un sistema completo de temporización de volatilidad que te muestra exactamente cuándo los mercados están a punto de moverse.
Oferta de lanzamiento limitada: Primeras 150 copias a $89 (ahorra $30)
"La diferencia entre el trading amateur y profesional a menudo se reduce a la temporización de la volatilidad. Este indicador cierra esa brecha."
Agrega al carrito ahora → Comienza a operar la volatilidad como un profesional.
5 | 50 % | |
4 | 50 % | |
3 | 0 % | |
2 | 0 % | |
1 | 0 % |