Visual Risk Execution Terminal
지표
버전 1.6, May 2026
Windows, Mac
5.0
리뷰: 1
설명
🎯 FlowFX 비주얼 리스크 실행 터미널
cTrader에서 전문적인 리스크 관리를 위한 궁극의 시각적 인터페이스.
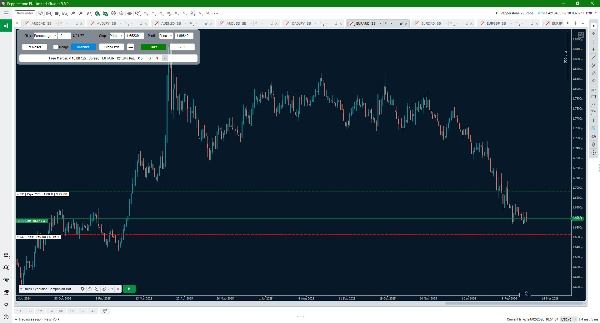
포지션 크기를 수동으로 계산하는 것을 멈추세요. FlowFX 비주얼 리스크 실행 터미널은 차트를 인터랙티브 실행 대시보드로 변환하여 드래그 앤 드롭 라인을 사용해 시각적으로 거래를 정의할 수 있게 하며, 인디케이터가 복잡한 수학 계산을 실시간으로 처리합니다.
🚀 주요 기능
- 시각적 거래 계획: 캔들 위에 진입, 손절, 이익 실현을 직접 표시하세요.
- 동적 로트 크기 조정: 계좌 잔액, 자본 또는 고정 현금 금액을 기반으로 정확한 거래량을 자동 계산합니다.
- 손익 예상: 거래를 실행하기 전에 계좌 통화로 얼마를 벌거나 잃을지 정확히 확인할 수 있습니다.
- 배치 동기화 모드: 차트 전체에 "목표선"을 표시하여 종료 위치를 이동할 때 모든 열린 포지션의 누적 손익에 미치는 영향을 확인할 수 있습니다.
- 첨단 HUD: 시니어 시스템 엔지니어가 설계한 미니멀하고 고성능 UI로 가격 움직임 분석에 방해가 되지 않습니다.
🤖 실행 생태계
이 시각적 계획을 지연 없이 실시간 주문으로 변환하기 위해, 이 인디케이터는 Quick Execution Companion Bot과 완벽하게 연동됩니다. 인디케이터는 "의도"를 계산하고, 동반 봇이 "실행"을 처리합니다.
🔗 완벽한 세트 구성:
원클릭 실행을 위해 무료 Quick Execution Companion Bot을 다운로드하세요.
💬 지원 및 피드백
정밀함을 위해 제작되었습니다. 기능 요청이나 버그를 발견하시면 주저하지 말고 연락해 주세요! 함께 터미널을 개선해 나갑시다. 🛠️
리스크를 추측하지 마세요. FlowFX로 시각화하세요. ⚡
요약
지표 프로필
지표 카테고리
패턴
출력 유형
시각화
데이터 요구 사항
막대만
고객 리뷰
5.0
리뷰: 1
5 | 100 % | |
4 | 0 % | |
3 | 0 % | |
2 | 0 % | |
1 | 0 % |
고객 리뷰
April 21, 2026
This platform perfectly fits my trading needs, especially the ability to quickly switch between the four order trigger types. Knowing that CTrader charts are drawn based on the Ask line is crucial—it makes a huge difference for the precise execution of Limit and Stop orders, solving a major pain point for me. The UI is also beautifully designed. If you are a trader who manually manages fixed risk, this software is an excellent choice. Highly recommended!
상담
자주 묻는 질문(FAQ)
Prop
Forex
Scalping
Indices
Commodities
Crypto
Stocks
트레이딩 봇, 지표, 플러그인 등 cTrader Store에서 제공되는 상품은 제3자 개발자에 의해 제공되며, 이는 단순히 정보 및 기술적 접근을 목적으로 제공된 것입니다. cTrader Store는 중개인이 아니며, 투자 조언, 개인별 추천 또는 향후 성과에 대한 어떠한 보장도 제공하지 않습니다.


가격
가입일 25/09/2025
25
판매
315
무료 설치