
Bollinger Bands Cloud
Indicador
Versión 1.0, Oct 2025
Windows, Mac
4.5
Valoraciones: 2
Descripción
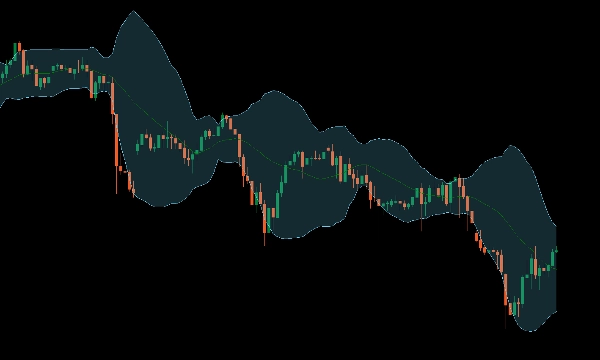
Presentamos nuestro indicador mejorado de Bandas de Bollinger, diseñado para elevar su experiencia de trading con una visualización más clara.
Esta mejora visual facilita la interpretación de la volatilidad del mercado e identifica posibles puntos de ruptura y reversión. Ideal para traders que buscan perspectivas más claras y una mejor toma de decisiones.
Actualice su conjunto de herramientas de trading hoy para un análisis más preciso y mejores resultados.
Resumen
Perfil del indicador
Valoraciones de clientes
4.5
Valoraciones: 2
5 | 50 % | |
4 | 50 % | |
3 | 0 % | |
2 | 0 % | |
1 | 0 % |
Valoraciones de clientes
October 27, 2025
Win rate means less without average R. It helps separate patience from hesitation.
October 20, 2025
The setup gets reviewed from another angle, but overconfidence is the real danger.
Conversación
Preguntas frecuentes
BTCUSD
Forex
Signal
Breakout
Indices
EURUSD
Commodities
GBPUSD
NZDUSD
Bollinger
Prop
Scalping
Crypto
Stocks
XAUUSD
NAS100
USDJPY
Los productos disponibles a través de cTrader Store, incluidos bots, indicadores y plugins para operar, son proporcionados por desarrolladores de terceros y están disponibles únicamente con fines informativos y de acceso técnico. cTrader Store no es un bróker, por lo que no proporciona asesoramiento de inversión, recomendaciones personales ni ninguna garantía de rentabilidad futura.


![Logotipo de "[Hamster-Coder] Moving Average MTF"](https://cdn.ctrader.com/image/webp/b11b98b1-194d-4b8e-b00e-d611826ad159_31226)


Precio
Desde 25/09/2025
25
Ventas
333
Instalaciones gratis