
Multi-Timeframe Bias Supply-Demand AssistantV1
지표
버전 2.0, Jul 2026
Windows, Mac

161.7M
거래량
23.6K
핍 수익
설명
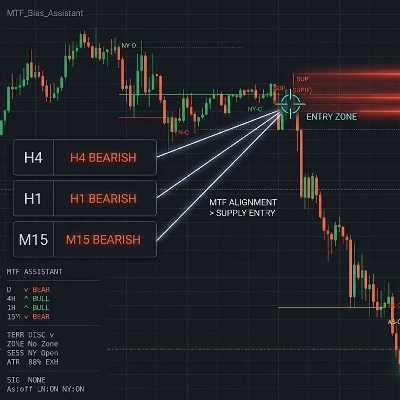
이것은 cTrader 플랫폼에서 데이터 시각화를 위해 설계된 전문가급 다중 타임프레임(MTF) 시장 분석 도구입니다. 골드(XAU/USD), 지수 또는 BTC와 같은 자산에 대해 구조적 구역, 다중 타임프레임 구조 방향 편향, 세션 타이밍 및 캔들스틱 패턴 식별의 매핑을 자동화하여 객관적이고 규칙 기반의 시장 분석을 제공합니다.
1. 분석된 시장 데이터 및 조건
이 도구는 여러 계층에 걸친 실시간 틱 및 과거 데이터를 처리하여 구조적 시장 조건을 평가합니다:
- 다중 타임프레임 방향 편향: 일간, 4시간(H4), 1시간(H1), 15분(M15)의 네 가지 뚜렷한 시간대에 걸쳐 구조적 수준 대비 가격을 동시에 평가합니다.
- 시장 구조 및 가치: 현재 일 중간점(균형점 - EQ)을 계산하여 상대적 할인 및 프리미엄 가격 위치를 식별합니다. 스윙 피벗과 임펄스 확장을 사용하여 시장 구조 변화를 탐색합니다.
- 불균형 추적: 구조적 불균형에 연결된 공정 가치 갭(FVG)의 존재를 감지하여 변위를 식별합니다.
- 변동성 추적: 14일 평균 진폭(ATR)과 비교하여 현재 일간 범위를 모니터링하여 통계적 과도 확장을 판단합니다.
- 시간 필터: 정확한 UTC 경계를 통해 주요 글로벌 거래 세션을 식별합니다: 아시아 오픈, 런던, 뉴욕 오픈.
2. 시각적 요소 및 분석 해석
차트 상의 시각적 요소는 가격이 과거에 상호작용했던 구조적 영역을 표시합니다:
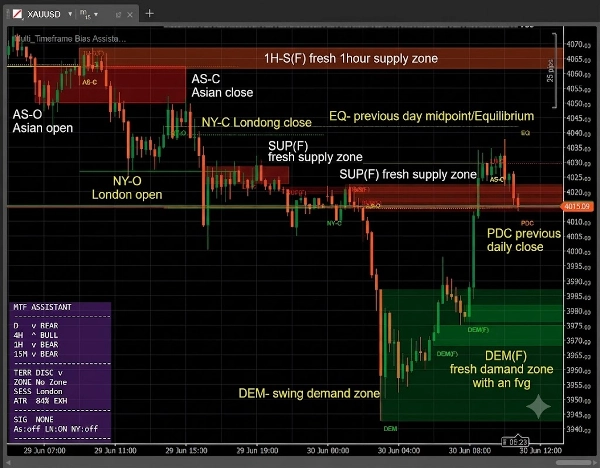
- 구조적 구역: 색상 박스로 렌더링됩니다. 표준 수요 구역은 녹색 채우기와 녹색 테두리를 특징으로 하며; H1 수요 구역은 파란색/청록색으로 표시됩니다. 표준 공급 구역은 빨간색 채우기를 특징으로 하며; H1 공급 구역은 주황색으로 표시됩니다.
- 일간 기준선: PDO(이전 일간 시가)는 흰색 실선으로 표시되고; PDC(이전 일간 종가)는 주황색 선으로 표시되며; 일간 EQ(균형점)는 일간 범위의 50% 되돌림 수준을 추적하는 노란색 선으로 표시됩니다.
- 세션 오픈 마커: 세션 오프닝을 표시하는 색상 수평선(아시아는 노란색, 런던은 빨간색, 뉴욕은 녹색)입니다.
합류
- 합류 대시보드: 사용자 정의 기술 기준이 동시에 일치할 때 대시보드에 시각적 매트릭스를 표시합니다. 예를 들어, 가격이 일간 균형점 아래의 새로운 수요 구역과 상호작용하고 상위 타임프레임 구조가 긍정적인 방향으로 정렬될 때 강세 정렬 상태가 강조 표시됩니다.
3. 주요 설정 및 매개변수
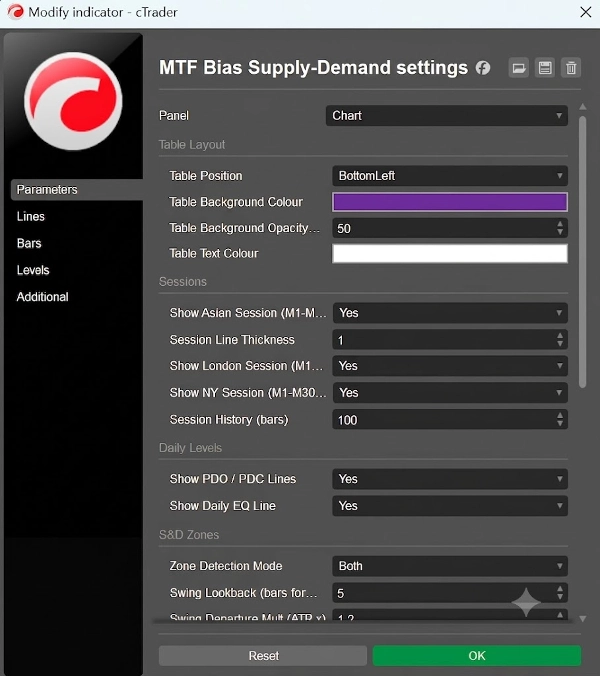
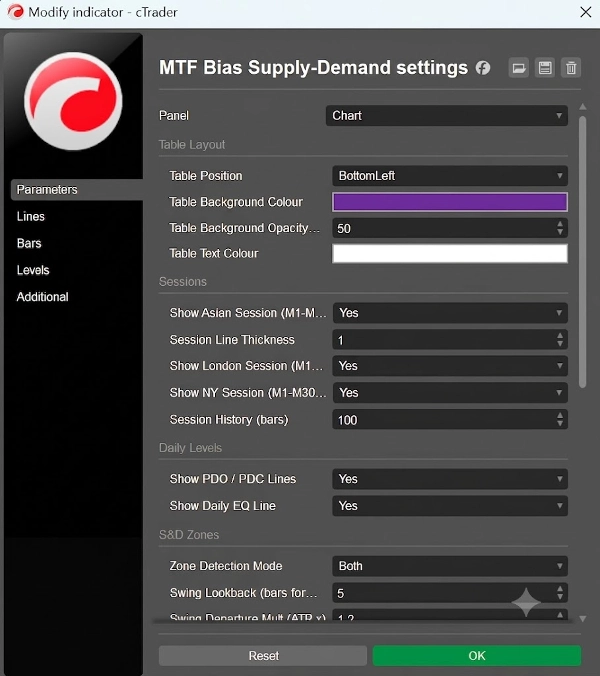
- 구역 감지 모드 (SwingOnly, ImpulseOnly, 또는 Both): 구조적 구역을 정의하는 데 사용되는 수학적 논리를 결정합니다.
- FVG 필요 여부 (True/False): 활성화 시, 확인된 공정 가치 갭 불균형이 동반된 경우에만 구역이 플로팅됩니다.
- 구역 재테스트 최대 횟수: 구역이 차트에서 만료되기 전에 테스트할 수 있는 최대 횟수를 정의합니다. 0으로 설정하면 첫 터치 시 즉시 구역이 제거됩니다.
- 일간 ATR 소비 비율 (AtrLimit): 기본값은 0.80 (80%)입니다. 자산이 평균 일간 범위의 80%를 이미 초과 이동했을 경우 필터링 메커니즘을 제공하여 확장 소진을 강조합니다.
4. 기술적 작업 흐름 예시
시장 개장 시 차트를 모니터링할 때, 도구는 동시 기술 요소를 표시하기 위해 데이터를 처리합니다. 상위 타임프레임 매트릭스가 강세 구조 정렬을 나타내고 가격이 이후 일간 균형선 아래로 이동하여 H1 수요 구역에 진입하면, 인터페이스는 PIN 라벨을 플로팅하고 대시보드 상태를 업데이트합니다. 이는 사용자가 사전 구성된 규칙 세트를 인터페이스에서 직접 체계적이고 시각적으로 요약할 수 있게 합니다.
5. 대상 사용자 프로필
- 경험 수준: 중급에서 고급.
- 분석 스타일: 시스템 기반 분석, 다중 타임프레임 구조 매핑, 세션 볼륨 추적.
- 전략적 호환성: 체계적 가격 행동 모델, 구조적 공급/수요 프레임워크 또는 다중 타임프레임 상관 모델 실무자를 위해 설계됨.
6. 제한 사항 및 사용 참고
- 타임프레임 가시성 매트릭스: 차트 명확성을 유지하기 위한 내장 가시성 필터를 특징으로 합니다. 하위 타임프레임 구역 및 마이크로 패턴은 실행 뷰(M1부터 M15까지)로 제한됩니다. 세션 라인은 M30 뷰 이상에서 자동으로 숨겨지며, H1 구역은 H1 뷰 이상에서 숨겨집니다.
- 고정 UTC 세션 시계: 세션 경계 추적은 고정 UTC 시간(아시아: 00:00-07:00, 런던: 07:00-16:00, 뉴욕: 12:00-21:00)에 직접 매핑됩니다. 브로커 서버 시간이 표준 UTC와 다를 경우 수동 조정이 필요할 수 있습니다.
- 자동 재테스트 가지치기:
ZoneRetestMax = 0일 때, 작은 유동성 꼬리가 구역 정의를 화면에서 제거합니다. 사용자는 즉각적인 터치와 지속적인 완화 블록에 대한 선호도에 따라 이 설정을 조정해야 합니다.
요약
AI summary
The Multi-Timeframe Bias Supply-Demand AssistantV1 is a professional-grade indicator for the cTrader platform that automates multi-timeframe market analysis. It evaluates price action and structural conditions across four timeframes—Daily, 4-Hour, 1-Hour, and 15-Minute—to identify directional bias and high-probability supply and demand zones. The tool processes live tick and historical data to detect market structure shifts using swing pivots and impulse expansions, track imbalances via Fair Value Gaps, and monitor volatility relative to the 14-day Average True Range (ATR).
Visual elements include color-coded structural zones (demand and supply), daily reference lines (previous open, close, and equilibrium), and session open markers for Asian, London, and New York trading sessions. A confluence dashboard highlights when multiple technical criteria align, aiding systematic analysis.
Key configurable settings allow users to define zone detection logic, require Fair Value Gap confirmation, limit zone retests, and filter signals based on daily ATR consumption. The indicator supports intermediate to advanced traders employing systematic price action, supply/demand frameworks, or multi-timeframe correlation strategies. Timeframe visibility filters and fixed UTC session clocks help maintain chart clarity and session accuracy.
Visual elements include color-coded structural zones (demand and supply), daily reference lines (previous open, close, and equilibrium), and session open markers for Asian, London, and New York trading sessions. A confluence dashboard highlights when multiple technical criteria align, aiding systematic analysis.
Key configurable settings allow users to define zone detection logic, require Fair Value Gap confirmation, limit zone retests, and filter signals based on daily ATR consumption. The indicator supports intermediate to advanced traders employing systematic price action, supply/demand frameworks, or multi-timeframe correlation strategies. Timeframe visibility filters and fixed UTC session clocks help maintain chart clarity and session accuracy.
지표 프로필
지표 카테고리
지지 및 저항
출력 유형
시각화
데이터 요구 사항
틱 데이터
막대만
지원되는 신호
반전
추세 강도
변동성
레벨 터치
고객 리뷰
0.0
리뷰: 0
고객 리뷰
이 상품에 대한 리뷰가 아직 없습니다. 이미 사용해 보셨나요? 다른 사람들에게 가장 먼저 소개해 주세요!
상담
자주 묻는 질문(FAQ)
Engulfing
Fair Value Gap
Key Levels
Liquidity Sweep
Market Structure
Supply & Demand
ATR
트레이딩 봇, 지표, 플러그인 등 cTrader Store에서 제공되는 상품은 제3자 개발자에 의해 제공되며, 이는 단순히 정보 및 기술적 접근을 목적으로 제공된 것입니다. cTrader Store는 중개인이 아니며, 투자 조언, 개인별 추천 또는 향후 성과에 대한 어떠한 보장도 제공하지 않습니다.


















가격
161.7M
거래량
23.6K
핍 수익