

説明
Easy Trade: cTrader用トレンド&ブレイクアウトインジケーター
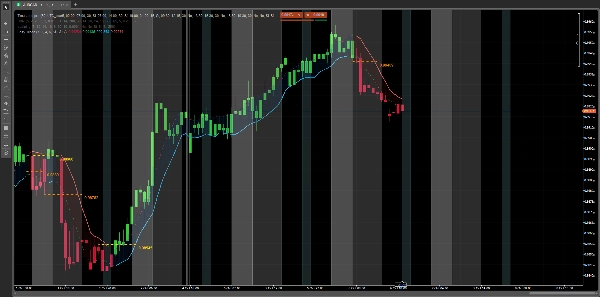
Easy Tradeは市場構造を読み取り、チャート上にトレンドの状態を直接表示します。余計なものはありません。
機能概要
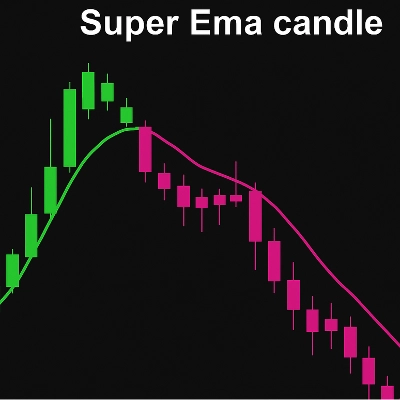
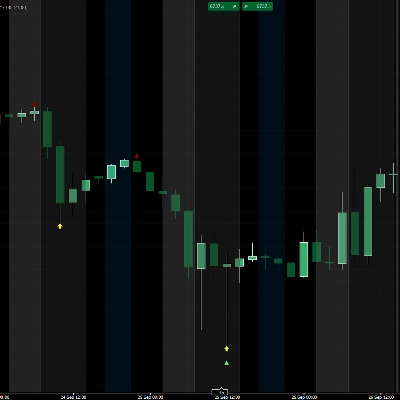
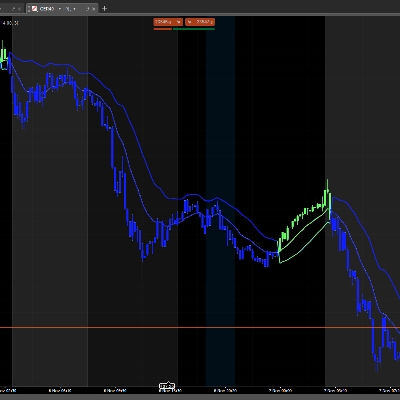
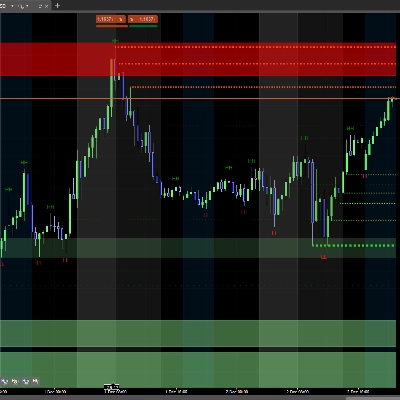
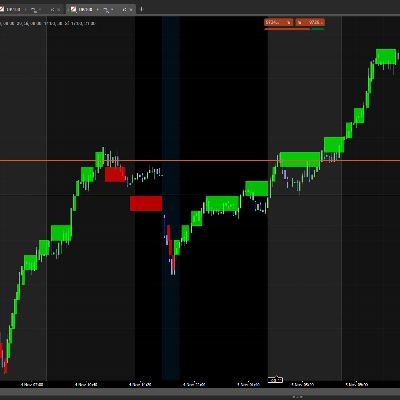
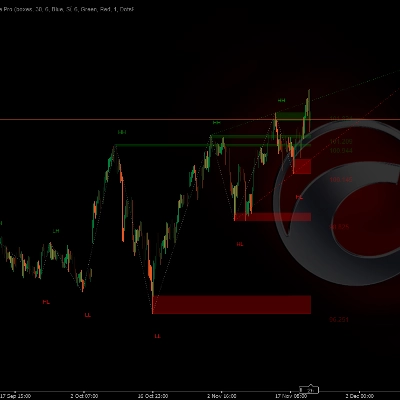
- カラーキャンドル:シグナルが変わると実際のチャートのキャンドルの色が変わります:強気、弱気、中立。キャンドルの上に何も描画されません。
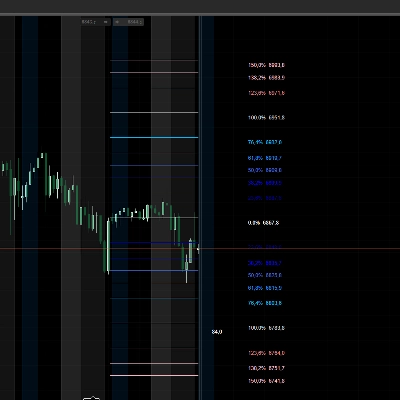
- ブレイクアウトレベル:新しいトレンドが始まると、重要なエントリーレベルをラインと価格で示します。ラインはブレイクアウト後に選択したキャンドル数分延長されます。
- トレンドゾーン:アクティブなトレンドの区間をプロットし、塗りつぶしでゾーンをシェードできます。
- クリーンで高速:軽量でオーバーレイとして動作し、プラットフォームの動作を遅くしません。
完全にカスタマイズ可能
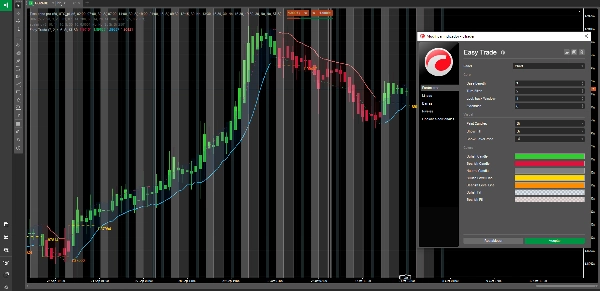
- ネイティブのcTraderカラーピッカーで各要素の色を選択できます:強気、弱気、中立のキャンドル、レベルライン、ゾーンの塗りつぶし(透明度調整可能)。
- キャンドルの色付け、塗りつぶし、レベル価格の表示をオン・オフできます。
- 感度、ターンフィルター、遡及ウィンドウ、ライン延長を調整して自分のスタイルに合わせられます。
対応
- あらゆるシンボルとタイムフレーム:FX、指数、金属、暗号通貨。
- トレンドフォロー、ブレイクアウトトレード、視覚的確認に最適です。
リスク警告:このインジケーターは分析ツールであり、金融アドバイスではありません。過去のパフォーマンスは将来の結果を保証するものではありません。常に適切なリスク管理を行ってください。
© tradingpro.0
概要
AIによる概要
Easy Trade is a trend and breakout indicator designed for the cTrader platform. It analyzes market structure and visually represents the current trend state directly on the price chart without adding clutter. Key features include:
- Colored candles that change hue to indicate bullish, bearish, or neutral market conditions by altering the actual chart candles.
- Breakout levels marked by lines and price labels at the start of new trends, with customizable line extension duration.
- Trend zones that highlight active trend legs with optional shaded fills.
- Lightweight overlay design ensuring fast performance without slowing down the platform.
The indicator is fully customizable, allowing users to select colors for bullish, bearish, and neutral candles, level lines, and zone fills with adjustable transparency. Users can enable or disable candle coloring, zone fills, and breakout price labels. Sensitivity, turn filters, look-back windows, and line extensions can be adjusted to match individual trading styles.
Easy Trade supports all symbols and timeframes, including Forex, indices, metals, and cryptocurrencies. It is suitable for trend following, breakout trading, and visual trend confirmation. The indicator provides signals such as cross, breakout, trend strength, and level breaks based on tick and bar data.
インジケーターのプロフィール
インジケーターのカテゴリー
トレンド
出力の種類
シグナル
データ要件
ティックデータ
バーのみ
サポート対象のシグナル
クロス
ブレイクアウト
トレンドの強さ
ラインブレイク
ディスカッション
カスタマーレビュー
4.4
レビュー: 5
5 | 40 % | |
4 | 60 % | |
3 | 0 % | |
2 | 0 % | |
1 | 0 % |
カスタマーレビュー
October 18, 2026
Colouring the candles keeps the trend state directly on price. Breakout labels and optional shaded legs add context without another pane. Sensitivity and turn filters change which moves qualify, so the cleaner view or faster response is an analytical setting rather than just a colour preference.
October 16, 2026
The faster response versus cleaner view choice is exposed through sensitivity and turn filters. That gives the candle colouring a clear analytical basis. A fairly focused trend display, with optional shaded legs adding context and no order execution implied by the chart state.
October 16, 2026
Easy Trade provides clear trend-state visualization through colored candles, directional lines, filled zones and breakout levels. Testing on EURUSD and XAUUSD across H1 and M1 showed consistent rendering and good visual alignment between price structure, trend direction and marked levels.
October 11, 2026
candle colours, breakout labels and shaded legs make the trend reading visually direct. The sensitivity controls give some choice over responsiveness. A useful overlay, with the important distinction that changing those filters alters recognised turns rather than merely repainting the same information.
October 10, 2026
Coloured candles, optional shaded legs and breakout labels make a really cohesive trend view, with sensitivity and turn filters controlling the interpretation rather than merely changing the paint.
よくあるご質問
Supertrend
Moving Average
cTrader Storeで入手可能な取引ボット、インジケーター、プラグインなどの商品は、第三者の開発者が提供するものであり、情報と技術の取得のみを目的としてご利用いただけます。cTrader Storeはブローカーではなく、投資助言や個人的な推奨を行うことも、将来のパフォーマンスを保証することもありません。








価格

登録日 24/02/2025
18
販売
2.24K
無料インストール