


الوصف
⚠️تحديث استمتع بمعلومات عميقة حقيقية⚠️
🔥 لوحة خريطة الحرارة 📈
محطة تدفق الأوامر والزخم بمستوى مؤسسي لـ cTrader.
إن لوحة خريطة الحرارة ليست مجرد تراكب رسم بياني أساسي—إنها نظام تداول مكون من ثلاثة أجزاء مدمج مباشرة في منصتك. يمنحك رؤية "الأشعة السينية" لسيولة السوق، ومتوسطات مرجحة بالحجم الحقيقية، والاتجاهات على المستوى الكلي، كل ذلك دون إبطاء جهاز الكمبيوتر الخاص بك. ⚡
🎯 ما الذي يفعله (وجهة نظر المتداول)
يقسم النظام تداولك إلى ثلاث خطوات بسيطة:
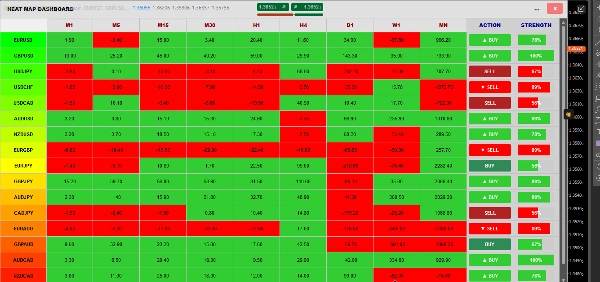
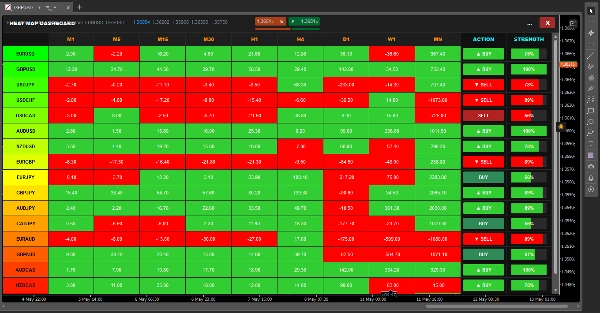
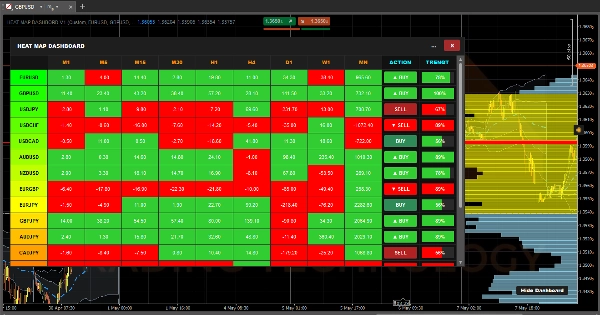
- 🎛️ الخطوة 1: ماذا تتداول (المصفوفة). بدلاً من النقر عبر عشرات الرسوم البيانية، تقوم اللوحة بمسح 17 أصلًا مختلفًا عبر 9 أطر زمنية (من M1 إلى شهري). تحسب الزخم لكل خلية وترمزها بالألوان. بنظرة واحدة، تعرف بالضبط أي زوج في اتجاه ضخم وجاهز للتداول.
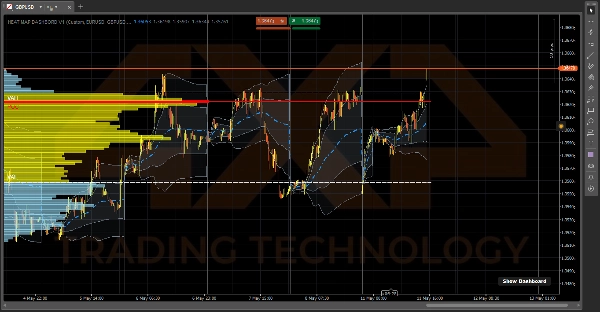
- 🌊 الخطوة 2: من يسيطر (VWAP). بمجرد اختيار زوج، انظر إلى VWAP اليومي المثبت. يظهر لك السعر المتوسط الحقيقي بناءً على الحجم، وليس فقط الشموع. تعمل سحب الانحراف المعياري المظللة كدعم/مقاومة ديناميكية، تظهر لك بالضبط متى يكون السوق في حالة شراء مفرط أو بيع مفرط.
- 📊 الخطوة 3: أين تدخل (VRVP). أخيرًا، يقوم ملف حجم النطاق المرئي بتحديد مكان تواجد السيولة المؤسسية الثقيلة بالضبط. يرسم تلقائيًا نقطة التحكم (POC) وخطوط 70% منطقة القيمة (VAH & VAL)، مما يمنحك مستويات دقيقة جدًا لتنفيذ دخولك وخروجك.
⚙️ كيف يعمل (تحت الغطاء)
معظم المؤشرات التي تحاول إجراء هذا الكم من الحسابات ستجمد منصتك على الفور وتتسبب في تعطل cTrader إلى استخدام 100% من وحدة المعالجة المركزية. لمنع ذلك، يتم تشغيل لوحة خريطة الحرارة بواسطة ثلاثة محركات مستقلة ومحسنة للغاية تعمل في نفس الوقت:
1. محرك اللوحة (نبضة القلب كل ثانيتين) ⏱️ إذا حسبنا 153 تركيبة (17 زوجًا × 9 أطر زمنية) على كل تغير سعري، سيذوب جهاز الكمبيوتر الخاص بك. بدلاً من ذلك، يعمل هذا المحرك على مؤقت نبضة قلب صارم كل ثانيتين. كل ثانيتين، ينظر بهدوء إلى السعر منذ 14 شمعة، يقارنه بالسعر الحالي، ويرسم الخلية باللون الأخضر (زخم إيجابي) أو الأحمر (زخم سلبي).
2. محرك VRVP (قارئ الشاشة) 🖥️ بدلاً من تحميل آلاف القضبان من البيانات التاريخية، يعمل ملف الحجم كـ "مستمع نافذة العرض" ديناميكي. ينشط فقط عندما تقوم بالتكبير أو التمرير فعليًا على الرسم البياني. يطلب من cTrader معرفة الشموع المرئية حاليًا على شاشتك، يحسب حجم التداخل الدقيق لتلك القضبان المحددة، ويعيد رسم منطقة القيمة 70% على الفور.
3. محرك VWAP (المجمع اللحظي) 🧮 VWAP هو الشيء الوحيد الذي يحسب على التغير اللحظي. ومع ذلك، للحفاظ على سرعته الفائقة، يستخدم "سلسلة بيانات تراكمية" خفيفة الوزن. بدلاً من إعادة حساب اليوم بأكمله كل ثانية، يضيف ببساطة حجم التغير الجديد إلى المجموع الجاري في الخلفية، ويمسح نفسه تلقائيًا في اللحظة الدقيقة التي تدق فيها الساعة منتصف الليل.
4. مدير النافذة (المغير الشكلي) 🪟 اللوحة مغلفة بمنطق تخصيص حجم مخصص بلغة C# يستمع بنشاط إلى شاشتك. عندما تضغط على تكبير [ ] أو استعادة [=] الأزرار، يقرأ المؤشر ديناميكيًا عرض الرسم البياني وارتفاع الرسم البياني في الوقت الحقيقي، ويتغير شكله فورًا ليتناسب مع شاشتك تمامًا دون الانهيار!
الملخص
1. Market Momentum Matrix: Scans 17 assets across 9 timeframes (from 1 minute to monthly), calculating and color-coding momentum to identify trending pairs quickly.
2. Daily Anchored Volume Weighted Average Price (VWAP): Displays true average prices weighted by volume, with dynamic standard deviation clouds indicating overbought or oversold conditions.
3. Visible Range Volume Profile (VRVP): Maps institutional liquidity by highlighting the Point of Control (POC) and 70% Value Area (VAH & VAL) within the visible chart range, aiding precise entry and exit levels.
The dashboard operates via four optimized engines: a 2-second heartbeat engine for momentum updates, a viewport-driven VRVP engine for volume profile recalculations, a tick-accumulating VWAP engine for real-time volume-weighted pricing, and a dynamic window manager that adjusts the interface to fit the chart size. This architecture ensures efficient performance and real-time responsiveness. The indicator supports visualization, signals (including trend strength, breakouts, and reversals), and filtering based on tick data, volume, and market structure analysis. It is tagged for aggressive trading, market structure, liquidity sweeps, support/resistance, and risk dashboard functionalities.
تقييمات العملاء
5 | 67 % | |
4 | 33 % | |
3 | 0 % | |
2 | 0 % | |
1 | 0 % |
مناقشة
الأسئلة الشائعة
المزيد من هذا المؤلف


























السعر