Fibonacci Linear Regression Multi-timeframe
指标
741 下载
版本 1.0, Feb 2025
Windows 版、Mac 版
5.0
评价:1
说明
🌟 斐波那契线性回归🌟
斐波那契回归带指标是一种先进的技术工具,结合了回归线和斐波那契水平的力量,用于识别金融市场中的趋势、支撑/阻力区域和潜在的反转点。📈 该指标通过同时分析多个时间框架(5分钟、15分钟、30分钟和4小时),提供多维视角,使交易者能够更精确地定位汇聚区域。⏳
🎯 指标的作用是什么?
该指标基于历史价格数据创建回归通道,并将其与斐波那契回撤水平结合,提供关键市场区域的综合视觉地图。通过分析不同时间框架,它提供了价格行为的整体视图,融合了长期趋势与短期价格动作。📊
🔍 主要组成部分
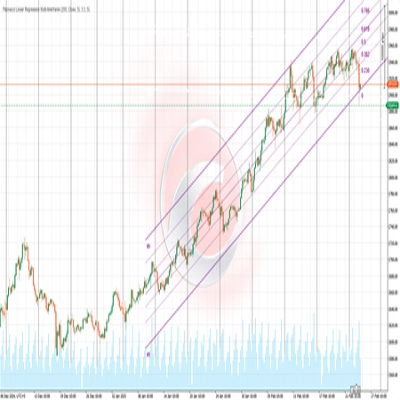
- 回归通道:指标计算用户定义周期内的线性回归线(默认:200根柱子),以显示整体价格趋势。📉📈
- 偏差带:在中心回归线周围绘制上下带,代表价格的统计偏差,类似于布林带,但基于线性回归。📐
- 斐波那契水平:在通道内绘制经典斐波那契水平(0、0.236、0.382、0.5、0.618、0.786和1),提供潜在的反弹或延续点。🔢
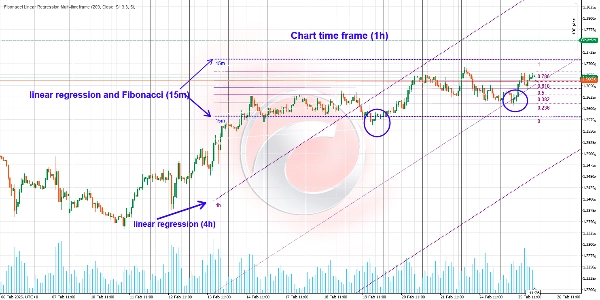
- 多时间框架分析:同时分析5分钟、15分钟、30分钟和4小时的时间框架,每个用不同颜色表示,帮助识别多个时间框架一致的区域。🎨
🔄 多维市场分析
该策略允许您从多个角度观察市场,整合长期趋势与短期价格波动。此方法实现:
- 随着市场变化动态调整交易。🔄
- 根据需要切换时间框架。⏱️
- 捕捉主要趋势中的大幅波动。🚀
- 利用较小波动优化进出场点。🎯
🔄 时间框架之间的互动
4小时时间框架与回归通道
- 提供对主导趋势的洞察。💪
- 为评估整体市场方向提供坚实基础。
- 在此情况下,可禁用斐波那契水平以避免杂乱。
- 重点仍放在显示主导趋势的回归通道上。
较低时间框架的回归与斐波那契
- 在较短时间框架(5分钟、15分钟或30分钟)激活回归线和斐波那契水平。
- 在更广泛的趋势背景下获得更精确的信号。
- 斐波那契水平帮助识别较大时间框架内的潜在进出场点。
📊 如何解读结果
识别趋势
- 中心回归线的方向指示主导趋势(看涨、看跌或横盘)。📈📉➡️
- 线的斜率暗示趋势强度——斜率越陡,趋势越强。🔍
- 来自不同时间框架的回归线在同一方向的汇聚表示强劲且可靠的趋势。
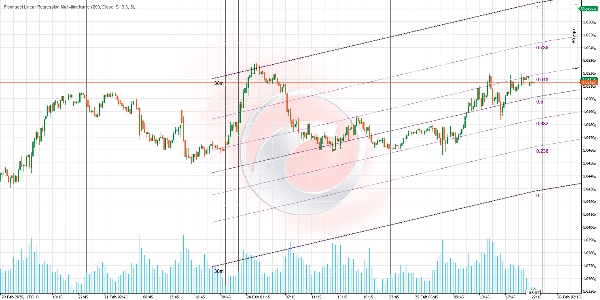
支撑和阻力区域
- 上下带作为动态支撑和阻力区域。🛡️
- 通道内的斐波那契水平提供额外的支撑/阻力,特别是在0.618和0.382处。
- 当不同时间框架的斐波那契水平一致时,会形成高概率的汇聚区域。
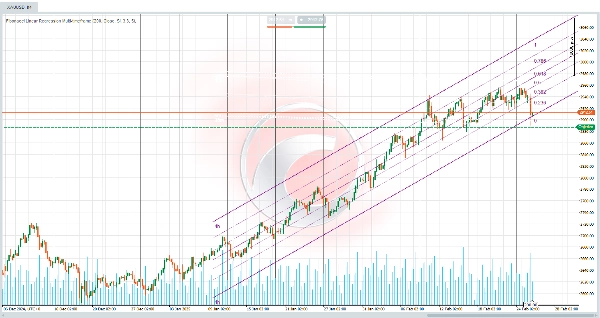
🌐 识别汇聚区域
汇聚区域是回归线和斐波那契水平重叠的地方。这些区域代表可能出现显著价格反应的点:
- 当斐波那契回撤与回归通道的上边缘或下边缘对齐时,作为强支撑或阻力点。
- 当来自不同时间框架的回归线相交或汇聚时。
- 当多个时间框架的斐波那契水平在特定区域重合时。
- 当价格恰好在与回归通道线重合的斐波那契水平反弹时。
🔄 识别反转区域
如果价格在较小时间框架突破回归通道并接近关键斐波那契水平,可能预示反转。其他反转信号包括:
- 过度延伸:当价格达到或超过上下带,尤其是与多个时间框架的斐波那契水平对齐时。
- 与动量指标的背离:结合RSI、MACD等指标可增强背离检测。
- 中心线突破:穿越中心回归线可能预示价格动态变化,尤其是同时发生在多个时间框架时。
🧩 多种情景
在多个时间框架中使用不同组合的回归通道和斐波那契水平,可以创造多样的交易情景:
- 在4小时时间框架保持多头仓位,同时在较小时间框架交易,利用斐波那契反弹获利。
- 使用4小时回归通道识别主要趋势,并在较小时间框架的斐波那契回撤中寻找最佳入场点。
- 利用多个时间框架的汇聚确认高概率的进出场点。
📈 交易策略
反转策略
- 识别多个时间框架的斐波那契水平和带汇聚的区域。
- 等待价格确认(蜡烛形态、背离等)。
- 逆势入场,设置紧密止损。
- 目标设在下一个斐波那契水平或中心回归线上。
延续策略
- 寻找回撤至中心线或关键斐波那契水平(0.382或0.618)。
- 确认整体趋势在多个时间框架内保持完整。
- 当价格从这些水平反弹时,顺势入场。
- 在相关斐波那契水平下方/上方设置止损。
通过利用斐波那契线性回归指标,交易者可以更深入地洞察市场动态,做出更明智的交易决策。保持敏锐,聪明交易!💻📈
Ctrader 商店指标:
摘要
指标配置
客户评价
5.0
评价:1
5 | 100 % | |
4 | 0 % | |
3 | 0 % | |
2 | 0 % | |
1 | 0 % |
客户评价
August 12, 2025
Pros: Draws linear regression channel and Fibonacci levels across multiple timeframes. Great for multi-TF trend and retracement analysis. Cons: No alerts or tooltips. Doesn’t support saving settings templates. Slight lag when many timeframes are active.
讨论
常见问答
Signal
Breakout
Supertrend
RSI
MACD
Bollinger
cTrader Store 提供的所有产品,包括交易机器人、指标和插件,均由第三方开发者提供,仅供信息参考和技术访问之用。cTrader Store 并非经纪商,不提供投资建议、个人推荐或任何未来业绩保证。


!["Gaussian Channel [Iridio Capital]" 标识](https://cdn.ctrader.com/image/webp/7c039209-5573-4a54-a072-f9528b503103_41960)
价格
注册日期 03/10/2024
163
销售
38.01K
免费安装