
Breakout channel
Indicateur
524 téléchargements
Version 1.0, Nov 2025
Windows, Mac
Description
Canaux de Cassure
Ce que cela fait
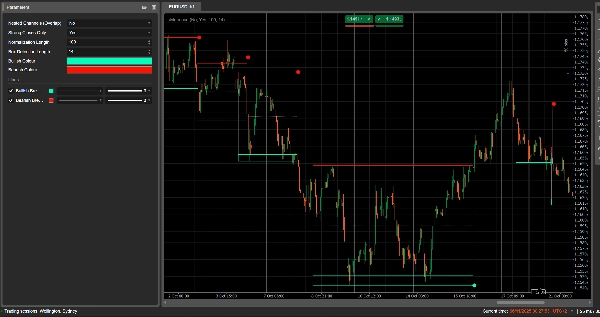
Canaux de Cassure détecte automatiquement les plages de consolidation (les « boîtes » de prix) et marque les points de cassure lorsque le prix sort de ces plages.
Il trace :
- Une boîte de canal grise autour de la zone de consolidation
- Une bande supérieure rouge (résistance potentielle)
- Une bande inférieure verte (support potentiel)
- Une ligne médiane blanche en pointillés (milieu du canal)
- Des points colorés lorsqu'une cassure se produit :
-
- Point vert/cyan sous la boîte → cassure haussière
- Point rouge au-dessus de la boîte → cassure baissière
L'idée est de mettre visuellement en évidence les zones où le prix se contracte et où des mouvements forts sont susceptibles de commencer lorsque la plage est rompue.
Comment il calcule
- Normalisation du prix
-
- Sur les Normalization Length dernières barres, il trouve le plus haut maximum et le plus bas minimum.
- Il normalise la clôture dans une plage de 0 à 1 :
normalizedPrice=Close−LowestLowHighestHigh−LowestLow\text{normalizedPrice} = \frac{\text{Close} - \text{LowestLow}}{\text{HighestHigh} - \text{LowestLow}}normalizedPrice=HighestHigh−LowestLowClose−LowestLow
- Mesure de la volatilité
-
- Il calcule l'écart-type du prix normalisé sur 14 barres.
- Cela donne une série de volatilité utilisée pour détecter les points de retournement dans la structure du marché.
- Lignes de « volatilité » supérieure / inférieure
-
- Sur les (Box Detection Length + 1) dernières barres, il trouve :
-
- la barre où la volatilité était la plus élevée
- la barre où la volatilité était la plus basse
- À partir du nombre de barres écoulées depuis ces extrêmes, il construit deux lignes synthétiques : Supérieure et Inférieure.
- Les croisements entre ces lignes signalent le début/la fin potentiels d'une phase de canal.
- Début et durée du canal
-
- Lorsque la ligne Inférieure croise au-dessus de la Supérieure, l'indicateur marque un début potentiel de canal.
- À partir de cette barre, il suit la durée et le plus haut maximum / plus bas minimum sur la période.
- Création du canal
-
- Lorsque plus tard la ligne Supérieure recroise au-dessus de la Inférieure, et que la durée est supérieure à 10 barres :
-
- Il définit le Haut du canal comme le plus haut maximum de cette période.
- Il définit le Bas du canal comme le plus bas minimum.
- Il mesure l'ATR/2 actuel pour séparer une zone fine en haut et en bas :
-
- Bande rouge en haut (bande baissière)
- Bande verte en bas (bande haussière)
- Il trace :
-
- Rectangle de contour gris (canal complet)
- Contour supérieur rouge
- Contour inférieur vert
- Une ligne médiane blanche en pointillés au centre
- Les canaux restent sur le graphique comme structure historique (ils ne sont pas supprimés après la cassure).
- Détection de cassure
-
- Pour chaque canal actif, à chaque nouvelle barre, il calcule un prix de référence :
-
- Si Strong Closes Only = true → utilise le point médian du corps de la bougie :
refPrice=(Open+Close)/2\text{refPrice} = (\text{Open} + \text{Close})/2refPrice=(Open+Close)/2
Cela nécessite que plus de la moitié du corps soit en dehors de la boîte. - Si Strong Closes Only = false → utilise simplement la clôture.
- Si Strong Closes Only = true → utilise le point médian du corps de la bougie :
- Règles de cassure :
-
- Si
refPrice > Top→ cassure haussière -
- Trace un point vert au Bas du canal.
- Désactive ce canal (arrête de l'étendre), mais la boîte reste visible.
- Si
refPrice < Bottom→ cassure baissière -
- Trace un point rouge au Haut du canal.
- Désactive le canal.
- Sinon, le canal reste actif et son bord droit est étendu à la barre actuelle.
- Si
- Option Canaux imbriqués
-
- Si Nested Channels = true, plusieurs canaux peuvent se chevaucher dans le temps et le prix.
- Si false, l'indicateur bloque la création d'un nouveau canal qui chevaucherait un canal existant.
Comment le lire et l'utiliser
- Boîte grise (canal)
-
- Représente une zone de consolidation / d'équilibre où le prix a évolué pendant un certain temps.
- Plus la boîte est longue et haute, plus la plage est significative.
- Bande supérieure rouge (zone de résistance)
-
- La partie supérieure du canal, visuellement mise en évidence comme une zone de résistance potentielle.
- Les rejets répétés près de cette bande suggèrent une pression vendeuse à l'intérieur de la plage.
- Bande inférieure verte (zone de support)
-
- La partie inférieure du canal, mise en évidence comme un support potentiel.
- Les rebonds répétés suggèrent des acheteurs défendant le bord inférieur de la plage.
- Ligne médiane blanche en pointillés
-
- Le point médian du canal – une sorte de « juste valeur » locale.
- Le prix oscillant autour de cette ligne indique un équilibre ; des mouvements forts à l'écart précèdent souvent un test de la bande opposée.
- Points de cassure
-
- Point vert sous la boîte :
-
- Le prix a clôturé fortement au-dessus du haut du canal (ou simplement au-dessus, selon Strong Closes Only).
- Cela suggère une cassure haussière – début potentiel d'une montée issue d'une compression de volatilité.
- Point rouge au-dessus de la boîte :
-
- Le prix a clôturé fortement en dessous du bas du canal.
- Cela suggère une cassure baissière – début potentiel d'une descente.
- Utilisations typiques (niveau idée)
-
- Cassures suivant la tendance
-
- Trader dans la direction de la cassure (acheter après un point vert, vendre après un point rouge), idéalement en confluence avec la tendance d'un timeframe supérieur ou d'autres indicateurs.
- Filtre & confirmation
-
- Utiliser le canal et sa cassure uniquement comme filtre pour votre stratégie existante (par exemple, ne prendre des positions longues que si le dernier signal était une cassure haussière).
- Placement du risque
-
- Pour les cassures haussières, de nombreux traders placent des stops à l'intérieur ou juste en dessous de l'ancien canal ; pour les cassures baissières, à l'intérieur ou au-dessus de la boîte.
Résumé
Résumé IA
Breakout Channels is a technical indicator designed to identify consolidation zones and signal potential price breakouts. It automatically detects price ranges where the market is coiling, marking these with a grey channel box that highlights the consolidation area. The indicator draws a red upper band indicating potential resistance, a green lower band indicating potential support, and a white dotted midline representing the channel midpoint or local fair value.
Breakout points are signaled by colored dots: a green or cyan dot below the box indicates a bullish breakout, while a red dot above signals a bearish breakout. The indicator calculates these zones by normalizing price data, measuring volatility through the standard deviation of normalized prices, and identifying volatility extremes to define channel start and duration.
Channels remain visible on the chart as historical structures even after breakouts. Users can enable nested channels to allow overlapping consolidation zones. Breakout detection uses either candle body midpoints or close prices, depending on settings, to confirm strong closes outside the channel.
Typical uses include trading in the breakout direction, filtering existing strategies, and placing risk stops near channel boundaries. The indicator supports various markets including forex, indices, commodities, stocks, and cryptocurrencies.
Profil de l'indicateur
Avis clients
0.0
Avis : 0
Avis clients
Il n'y a pas encore d'avis sur ce produit. Vous l'avez déjà essayé ? Soyez le premier à en parler aux autres !
Discussion
Questions fréquentes
Signal
Indices
Commodities
GBPUSD
RSI
Bollinger
Fibonacci
Scalping
AI
XAUUSD
NAS100
MACD
BTCUSD
Forex
Breakout
EURUSD
NZDUSD
Martingale
Prop
ZigZag
Supertrend
Fair Value Gap
SMC
Crypto
Grid
Stocks
ATR
USDJPY
VWAP
Les produits disponibles sur cTrader Store, notamment les bots de trading, les indicateurs et les plug-ins, sont fournis par des développeurs tiers et mis à disposition à titre informatif et à des fins d'accès technique uniquement. cTrader Store n'est pas un courtier et ne fournit aucun conseil en investissement, aucune recommandation personnelle ni aucune garantie quant aux performances futures.


![Logo de "Gaussian Channel [Iridio Capital]"](https://cdn.ctrader.com/image/webp/7c039209-5573-4a54-a072-f9528b503103_41960)


Prix
42.11M
Volume tradé
6.13M
Pips gagnés
230
Ventes
8.51K
Installations gratuites