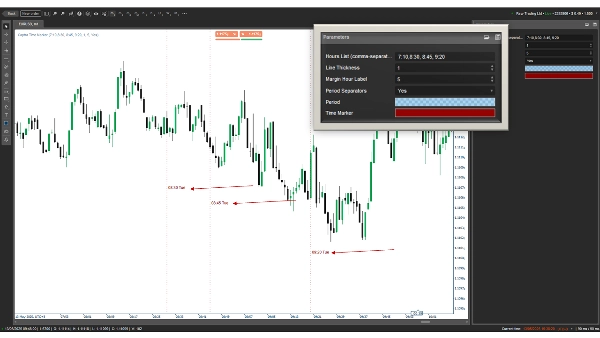
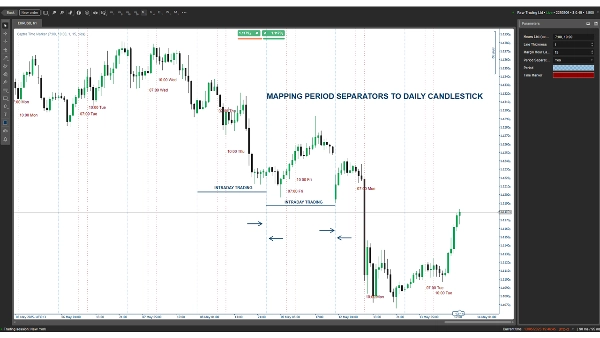
「Time Marker」ロゴ
Time Marker
「Time Marker」アップロード画像
82.18M
取引数量
1.64M
獲得pips
3.06K
無料インストール

Captra Time Marker enhances your cTrader experience by visually marking user-defined times (e.g., 7:10, 8:30) with dashed vertical lines and labeled text (e.g., "07:10 Mon"). Ideal for traders focusing on specific market hours, it supports customizable time inputs, line thickness, and label positioning. Optional daily period separators highlight session starts, with configurable colors and styles. Perfect for scalpers, day traders, and those needing precise time-based analysis. Easy to set up, lightweight, and compatible with all timeframes.

Indicator profile
0.0
レビュー: 0
カスタマーレビュー
この商品にはまだレビューがありません。お使いになったことがある方は、ぜひレビューをお願いします。
Products available through cTrader Store, including trading bots, indicators and plugins, are provided by third-party developers and made available for informational and technical access purposes only. cTrader Store is not a broker and does not provide investment advice, personal recommendations or any guarantee of future performance.

この作成者の他の商品

「Order Block Finder」ロゴ
5.0
(2)
無料
Order Block Detector is built to spot and display Order Blocks on chart, often triggering strong price reactions.
「High TF Plotter」ロゴ
4.6
(3)
無料
Captra High TF Plotter visualizes high timeframe Bar on lower timeframe charts, highlighting with bull/bear colors.
Detects Head & Shoulders patterns, plots signals, and alerts for trading opportunities.
cTrader indicator with mini-timeframe candlesticks. Customize timeframe, colors, margins. Perfect for traders.
Plots chosen symbol's close price, candlestick (wick, body) on cTrader chart, supports multiple timeframes.

これも好きかも

Draw as many Moving Averages as you need from a simple indicator.
It draws a step line that visualize the movement of H4. Particularly effective when trade on lower timeframe.
📈 Divergency v1.1 Indicator for cTrader: A Comprehensive Guide 🚀
Stochastic RSI
An indicator that accurately shows the trend direction. A vital tool for clear trading decisions.
Counts bars from the start of the sessions.
Analyze institutional imbalance with HAIQuantum_TheGame. A 20-factor ecosystem designed to identify
📊 🚀 “Anticipate the Market with Wyckoff Smart Zones – Discover Where Institutions Buy and Sell”
The Pressure Gap indicator identifies sudden price jumps without using volume.
BB Breakout Oscillator with alerts! Spot trend reversals using Bollinger Bands. Bullish/Bearish crossovers Alerts.
Professional Trading Indicator Transform Your Trading with Intelligent Signal Detection RenkoProfit
3 bar triangle = high below 2 day high, low above 2 day low
📈 Trading Sessions Indicator — London, New York & Tokyo Visualize Key Market Sessions + High/Low Levels with Precision
Buy at green arrow if trend is bullish and viceversa
Fractals is a precision-engineered trading indicator for cTrader that reveals the hidden architecture of price action.
The FZ indicator draws Fibonacci channel zones based on the highest and lowest prices over a user-defined period.
Linear regression line with deviation-based upper/lower channels for trend and reversal analysis.
INDICATOR,LIQUIDITY POOLS,ACCURATE SIGNAL, NO DELAY,80% PROBABILITY
82.18M
取引数量
1.64M
獲得pips
3.06K
無料インストール