
Opis
Prezentacja:
Wskaźnik MACD to dopracowana i wizualnie ulepszona wersja klasycznego oscylatora Moving Average Convergence Divergence (MACD) dla platformy cTrader. Stworzony, aby odzwierciedlać zachowanie i wygląd oryginału z TradingView, oferuje znane, profesjonalne doświadczenie z kilkoma inteligentnymi ulepszeniami.
Dlaczego wybrać wskaźnik MACD?
1. 100% kompatybilność z TradingView
Podstawowy algorytm stosuje dokładnie tę samą logikę co standardowy MACD na TradingView. Oblicza linię MACD jako różnicę między szybką a wolną średnią kroczącą, wyprowadza linię sygnału z trzeciej średniej kroczącej i rysuje histogram jako różnicę między nimi. Efektem jest idealne dopasowanie do wykresów, które już znasz.
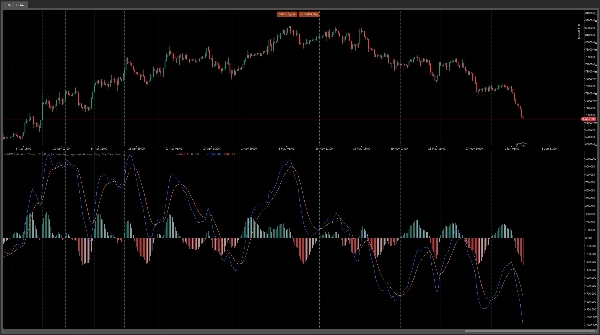
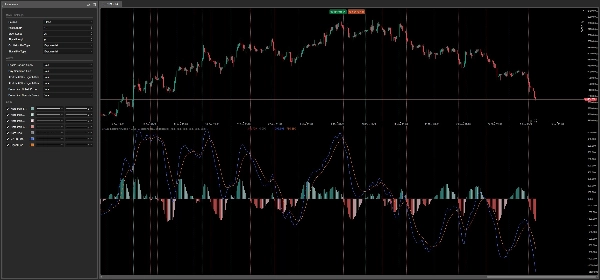
2. Inteligentny, czterokolorowy histogram
Zamiast prostego dwutonowego histogramu, ten wskaźnik używa dynamicznego systemu czterokolorowego gradientu identycznego z implementacją PineScript TradingView:
- Silny pozytywny – słupek histogramu jest powyżej zera *i* rośnie
- Słaby pozytywny – słupek histogramu jest powyżej zera *ale* spada
- Słaby negatywny – słupek histogramu jest poniżej zera *ale* rośnie
- Silny negatywny – słupek histogramu jest poniżej zera *i* spada
Ta inteligencja kolorów pozwala natychmiast ocenić, czy momentum przyspiesza czy słabnie, bez konieczności interpretowania surowych liczb.
3. Wbudowany system alertów z wyskakującymi oknami i dźwiękiem*
Bądź na bieżąco nawet gdy nie patrzysz na ekran. Wskaźnik może wysyłać natywne powiadomienia cTrader w formie wyskakujących okienek i odtwarzać charakterystyczne dźwięki, gdy:
- Linia MACD przecina linię sygnału od dołu (Korekta bycza – sygnał kupna)
- Linia MACD przecina linię sygnału od góry (Korekta niedźwiedzia – sygnał sprzedaży)
Każdy typ alertu można włączać niezależnie, a system jest zabezpieczony przed powielaniem alertów na tym samym słupku.
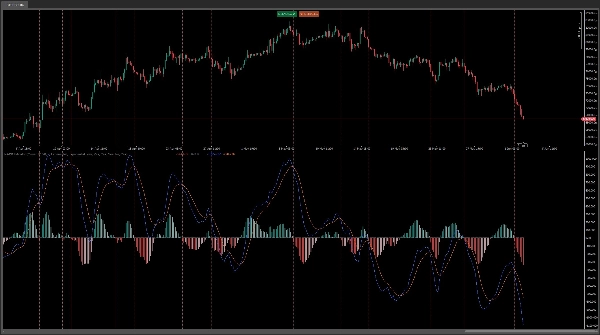
4. Konfigurowalne sygnały wizualne
Opcjonalnie możesz rysować przerywane linie pionowe na wykresie za każdym razem, gdy wystąpi byczy lub niedźwiedzi przecięcie. Ułatwia to szybkie przeglądanie historycznych wykresów i identyfikację stref sygnałów bez ręcznego przewijania danych.
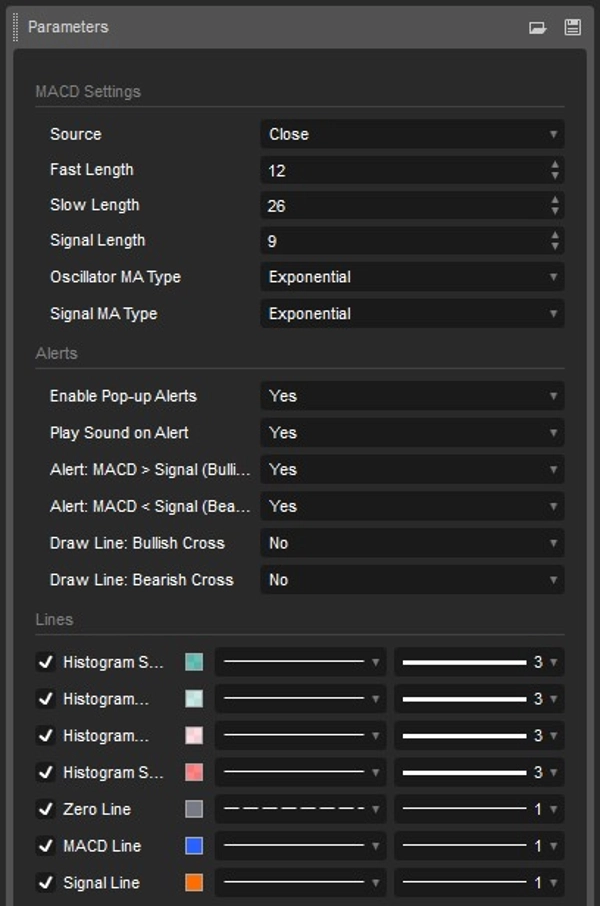
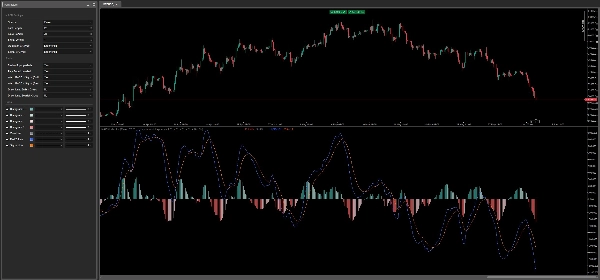
5. W pełni konfigurowalny i elastyczny
Dopasuj każdy aspekt wskaźnika do swojego stylu handlu:
- Fast Length – okres dla szybkiej średniej kroczącej
- Slow Length – okres dla wolnej średniej kroczącej
- Signal Length – okres dla średniej kroczącej linii sygnału
- Typ MA oscylatora – wybierz dowolny typ średniej kroczącej (EMA, SMA itp.) dla obliczeń MACD
- Typ MA sygnału – niezależnie wybierz typ MA dla linii sygnału
Dla kogo jest ten wskaźnik?
Zaawansowani użytkownicy TradingView, którzy chcą natywnego MACD dla cTrader, który zachowuje się, oblicza i koloruje dokładnie jak oryginał – bez niespodzianek i rozbieżności.
Traderzy dyskrecjonalni szukający jasnych, rzeczywistych alertów crossover z powiadomieniami wyskakującymi i dźwiękowymi, co ułatwia łapanie wejść bez ciągłego patrzenia na ekran.
Traderzy analityczni, którzy doceniają czterokolorowy histogram jako narzędzie diagnostyczne momentum – szybko identyfikują, czy presja bycza lub niedźwiedzia rośnie czy słabnie.
Wszystkie poziomy doświadczenia – MACD to podstawowy oscylator, a ta implementacja czyni go bardziej dostępnym niż kiedykolwiek dzięki czystej wizualizacji, inteligentnemu kodowaniu kolorów i w pełni konfigurowalnemu systemowi alertów.
cGuru
Podsumowanie
This indicator includes a built-in alert system with customizable pop-up and sound notifications for bullish and bearish MACD-signal line crossovers, with options to toggle alerts independently and prevent duplicates. Users can also enable vertical dotted lines on the chart to mark crossover events for easier historical analysis.
All parameters are fully customizable, including the periods for fast, slow, and signal moving averages, as well as the types of moving averages used (EMA, SMA, etc.). The indicator supports signals for crossovers and trend strength, and requires bar or tick data input. It is suitable for traders seeking a TradingView-compatible MACD with enhanced visual cues and real-time alerts on the cTrader platform.


![Logo „[Stellar Strategies] Inside Bar with Signals”](https://cdn.ctrader.com/image/webp/1d9e8bfa-3b2c-4440-bb37-5856902008a7_30683)


