present
Zarejestruj się i otrzymaj 50 $ zniżki na pierwszy zakup
Trading product for RSI Indicator Wskaźnik SMA RSI, image 1
RSI Indicator
Wskaźnik
Wersja 1.0, May 2026
Windows, Mac
Trading product for RSI Indicator Wskaźnik SMA RSI, image 2
Trading product for RSI Indicator Wskaźnik SMA RSI, image 3
95
Sprzedaż
171
Bezpłatne instalacje

Opis

Prezentacja:


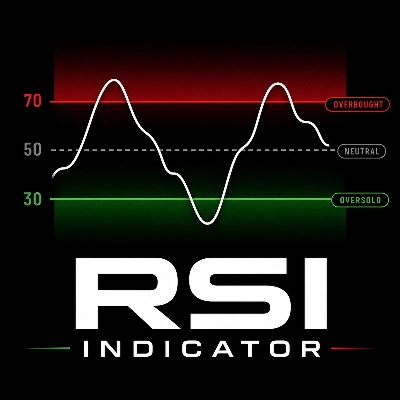
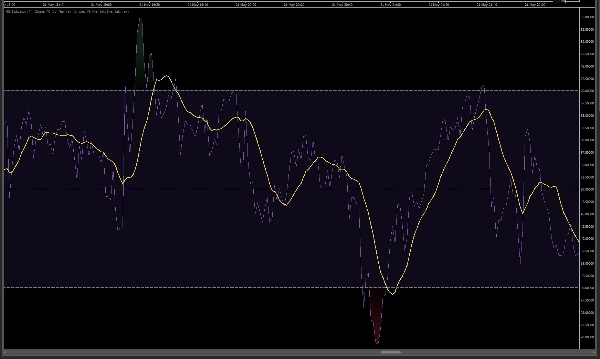
Wskaźnik RSI - ten wskaźnik to zaawansowana, a zarazem przejrzysta implementacja klasycznego oscylatora Relative Strength Index (RSI) dla platformy cTrader. Został opracowany ściśle zgodnie z oryginalnym wskaźnikiem z TradingView (na podstawie ich oficjalnej specyfikacji).

Dzięki zastosowaniu modelu wygładzania RMA (Running Moving Average), wskaźnik zachowuje się i wyświetla dokładnie tak samo jak jego odpowiednik z TradingView. Zapewniliśmy również w pełni zgodne doświadczenie wizualne.

Główne cechy i funkcje:

  • 100% zgodność z TradingView: Algorytm wykorzystuje dokładnie tę samą logikę obliczeń co oryginalny wskaźnik TV (oparty na wzorze RMA).
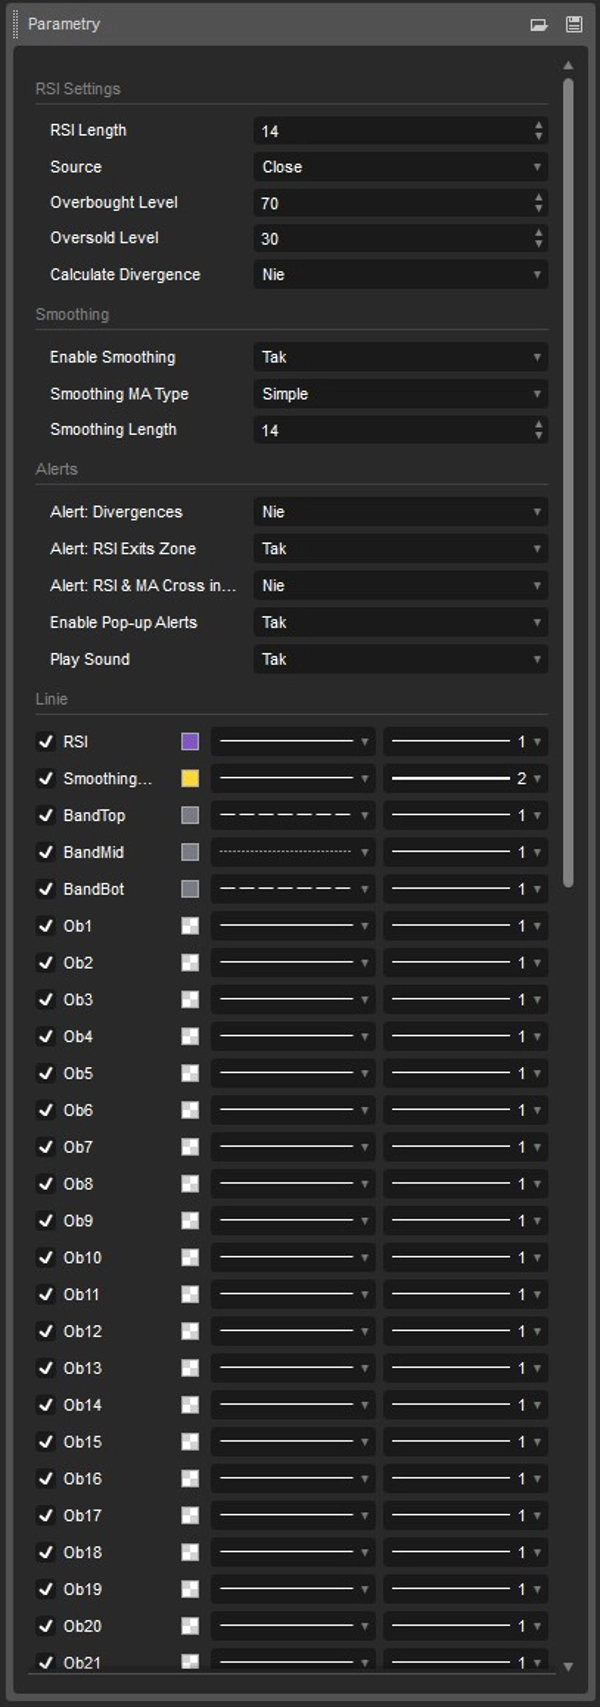
  • Oszałamiający design wizualny (dynamiczne gradienty): Zastosowano innowacyjny system cieniowania kolorów na 30 poziomach. Im wyżej RSI przesuwa się w strefę wykupienia (powyżej 70), tym intensywniejsze staje się czerwone tło. Im niżej spada w strefę wyprzedania (poniżej 30), tym głębsza staje się zieleń. Środkowy zakres zachowuje klasyczny fioletowy odcień.
  • Wbudowana średnia krocząca (MA): Jak w najnowszych wersjach TV, możesz włączyć linię średniej kroczącej (np. SMA), która wygładza linię RSI i pomaga identyfikować trendy wewnątrz samego oscylatora.
  • Automatyczne wykrywanie dywergencji: Wskaźnik może automatycznie skanować wykres w poszukiwaniu regularnych dywergencji. Gdy wykryje rozbieżność między ceną a siłą trendu RSI, rysuje linie i markery (bycze: zielone, niedźwiedzie: czerwone) bezpośrednio w oknie wskaźnika.
  • Potężny system alertów (wyskakujące okienka i dźwięk): Bądź na bieżąco przez cały czas. Wskaźnik powiadomi Cię, gdy:
    • RSI opuszcza strefy wykupienia/wyprzedania (generując klasyczne sygnały kupna/sprzedaży),
    • Linia RSI przecina linię MA głęboko w tych strefach,
    • Wykrywana jest nowa dywergencja.

Dla kogo jest ten wskaźnik?

Jeśli jesteś przyzwyczajony do analizy RSI na TradingView, szukasz idealnie dopasowanych sygnałów w cTrader i cenisz czysty, atrakcyjny wizualnie design (bez ręcznego dostosowywania kolorów), ten wskaźnik jest idealnym rozwiązaniem.

Prosty w użyciu, precyzyjny w działaniu i wierny oryginałowi!

cGuru

Podsumowanie

Podsumowanie AI
The RSI Indicator is a cTrader implementation of the classic Relative Strength Index oscillator, designed to replicate TradingView’s original indicator using the Running Moving Average (RMA) smoothing method. It provides 100% calculation compatibility with TradingView, ensuring identical signal behavior and visual presentation. Key features include a dynamic 30-level gradient color scheme that visually distinguishes overbought (red) and oversold (green) zones, with a neutral purple mid-range. The indicator supports an optional moving average line (e.g., SMA) to smooth the RSI curve and highlight trends within the oscillator. It also offers automatic detection of regular divergences between price and RSI trends, marking bullish and bearish divergences directly on the chart. A built-in alert system notifies users via pop-up and sound when the RSI exits overbought/oversold zones, crosses the moving average within these zones, or when new divergences are detected. This indicator is suitable for traders familiar with TradingView’s RSI who seek an accurate, visually clear, and feature-rich RSI tool within the cTrader platform.
Profil wskaźnika
Kategoria wskaźnika
Wsparcie i opór
Typ wyjścia
Wizualizacja
Wymagania dotyczące danych
Dane tickowe
Obsługiwane sygnały
Odwrócenie trendu
Dywergencja

Opinie klientów

0.0
Opinie: 0
Opinie klientów
Ten produkt nie ma jeszcze opinii. Wypróbowałeś(-aś) go już? Bądź pierwszy(-a) i powiedz o tym innym!

Dyskusja

Częste pytania

SMA
RSI
Moving Average
Produkty dostępne za pośrednictwem cTrader Store, w tym boty handlowe, wskaźniki i wtyczki, dostarczane są przez deweloperów zewnętrznych i udostępniane wyłącznie w celach informacyjnych oraz w celu zapewnienia dostępu technicznego. cTrader Store nie jest brokerem i nie zapewnia doradztwa inwestycyjnego, nie udziela spersonalizowanych rekomendacji ani nie gwarantuje przyszłych wyników.

Więcej od tego autora

Wskaźnik
AI
ATR
+27
Trend Is Your Friend cBot - INDICATOR - Professional Grid, Pyramid, Swing & Scalp Trading Indicator
Wskaźnik
AI
ATR
+27
Supertrend Indicator
Wskaźnik
AI
ATR
+27
Nadaraya-Watson Envelope Indicator
Wskaźnik
AI
ATR
+27
Supertrend Indicator
Wskaźnik
AI
ATR
+26
MacD Custom Indicator-Multiple Time Frame
cBot
AI
ATR
+27
RSI Simple Grid cBot - grid trading strategy with RSI (Relative Strength Index) signals
26.8%
ROI
4.41
Współczynnik zysku
Wskaźnik
AI
ATR
+27
Market Cipher B
Wskaźnik
AI
ATR
+19
Market Cipher A
cBot
AI
ATR
+27
SmartHedge cBot - Your Trading Companion
1.26
Współczynnik zysku
cBot
ATR
RSI
+5
Trend is your friend cBot - Professional Grid, Pyramid, Swing & Scalp Trading System
28%
ROI
5.27
Współczynnik zysku
Wskaźnik
EMA
SMA
+3
MACD indicator modeled after TradingView, featuring a 4-color momentum histogram, sound/pop-up crossover alerts.

Możesz także polubić

Wskaźnik
ATR
BOS
+5
Full ICT/SMC 4-step setup checker that alerts a long or short setup.
Wskaźnik
Grid
Prop
+14
Visualize trends with Standard Deviation Channel! Display median, and add customizable upper/lower deviation channels.
Wskaźnik
Laguerre RSI: smoother, faster RSI with less noise. Great for spotting reversals and timing entries.
Wskaźnik
Key Levels
Liquidity Sweep
Professional Opening Range Breakout, Initial Balance, False breakout Detection
Wskaźnik
ATR
SMC
+21
MA Quant Adaptive Price Zone Oscillator identifie dynamiquement les zones de prix optimales pour les entrées et sorties.
Logo „PivotLevels”
Najwyżej oceniane
4.7
(4)
$25
/
$30
Wskaźnik
Prop
Forex
+4
It draws Pivot Levels on the chart.
Wskaźnik
Forex
Flexible Volume Profile, designed with performance in mind.
Wskaźnik
BOS
Volume
+5
20/40/60-day IPDA lookback ranges, Premium/Discount/Equilibrium zones, and quarterly shift alerts — anchored to true dai
Wskaźnik
Forex
BTCUSD
+5
Auto-plots Open, High, and Low of Day/Week/Month/Year. Session candle counter + Round Numbers. Fully customizable
Wskaźnik
ATR
RSI
+24
Daily moving averages, simplified. Displays 3 daily moving averages on lower timeframes with selectable MA types.
Wskaźnik
Imbalance
Order Block
+5
Automated Nasdaq SMC for cTrader. Real-time FVG & Order Block mapping, interactive playbook HUD & zero-lag engine.
Wskaźnik
ATR
Key Levels
+5
CPR indicator that actually predicts the day ahead: width percentile scoring for breakout-day detection
Wskaźnik
MSS
AI-assisted
+5
Live ICT Silver Bullet detection: liquidity sweeps, structure shifts, and killzone-gated FVGs, graded and glowing in rea
Wskaźnik
Prop
Forex
+10
IBS Indicator – Measures price position within bars for smarter trades. Works on all markets & timeframes.
Wskaźnik
Forex
BTCUSD
+4
This indicator is designed to perform multiple non-linear regression analysis using four independent variables.
Wskaźnik
Forex
Crypto
+6
The cTrader Chaos Reversals indicator brings high-quality reversal signals to traders.
Wskaźnik
Prop
Forex
+13
Color Volume Bars – Visualize Market Strength Instantly
Wskaźnik
Forex
Crypto
+6
The ultimate candlestick suite is here to help you detect most of the candlestick patters that exist today.

Cena

95
Sprzedaż
171
Bezpłatne instalacje