Beschreibung
Forex Trend-Following Strategie Erklärung (Englisch)
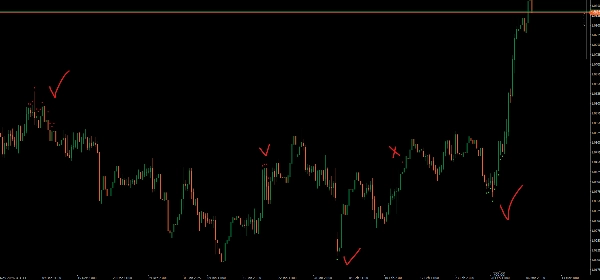
Diese Trend-Following-Strategie ist darauf ausgelegt, starke Markttrends mithilfe von Exponentiellen Gleitenden Durchschnitten (EMAs), MACD und ADX zu erkennen. Sie generiert Kauf- und Verkaufssignale basierend auf Momentum und Trendstärke.
Wie es funktioniert
1️⃣ Bestimmung der Trendrichtung
- Schneller EMA (21) und Langsamer EMA (50) bestimmen die allgemeine Trendrichtung:
-
- Aufwärtstrend → Schneller EMA liegt über dem Langsamen EMA
- Abwärtstrend → Schneller EMA liegt unter dem Langsamen EMA
2️⃣ Messung des Trendmomentums (MACD Histogramm)
- Das MACD-Histogramm bestätigt das Momentum:
-
- Bullishes Momentum → MACD-Histogramm liegt über null
- Bearishes Momentum → MACD-Histogramm liegt unter null
3️⃣ Überprüfung der Trendstärke (ADX-Indikator)
- Der ADX (14) misst die Trendstärke:
-
- Starker Trend → ADX liegt über 25
- Schwacher Trend → ADX liegt unter 25 (keine Signale)
Handelsausführung
✅ Kaufsignal (Bullischer Einstieg)
- Schneller EMA > Langsamer EMA (Aufwärtstrend)
- MACD-Histogramm > 0 (Momentumbestätigung)
- ADX > 25 (Starker Trend)
- 🔹 Kaufpfeil erscheint unter dem Tiefpreis
❌ Verkaufssignal (Bärischer Einstieg)
- Schneller EMA < Langsamer EMA (Abwärtstrend)
- MACD-Histogramm < 0 (Momentumbestätigung)
- ADX > 25 (Starker Trend)
- 🔻 Verkaufspfeil erscheint über dem Hochpreis
Hauptmerkmale
✔ Vermeidet schwache Trends mithilfe des ADX
✔ Filtert falsche Signale mit MACD-Bestätigung
✔ Anpassbare Parameter für bessere Individualisierung
Dieser Indikator hilft Tradern, starke Trends zu nutzen und gleichzeitig schwache Marktbedingungen zu vermeiden. 🚀