
Description
Indicateurs du magasin Pinescriptlabs : cBots du magasin Pinescriptlabs : (cBot) Gold & BTC BreakoutSession Pivots(nouveau)
Trailing Smart Algorithm (Nouveau)
Prédiction basée sur Linreg & ATR
SmartTrend Support &
Resistance
Lines
Analyse
Dynamique
de la Structure
du Marché
des
Points de retournement
Régression
Linéraire
Fibonacci
Multi-échelle
Gradient de Tendance Dynamique
Multi-niveaux
Biais des Chandeliers
Tracker
Support
et Résistance
Automatiques
Tendance
Lignes
Tous les
Supports et
Résistances
Niveaux
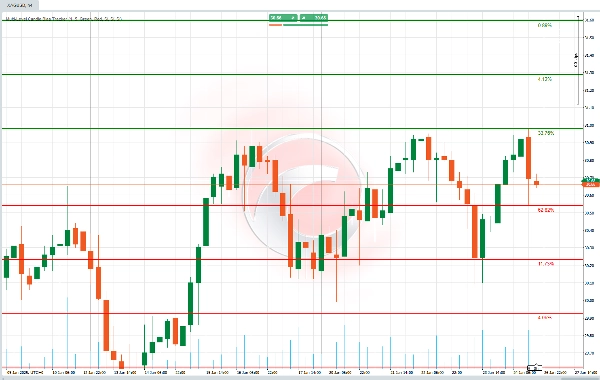
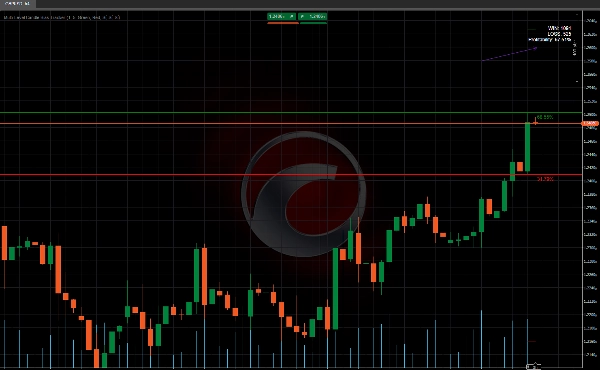
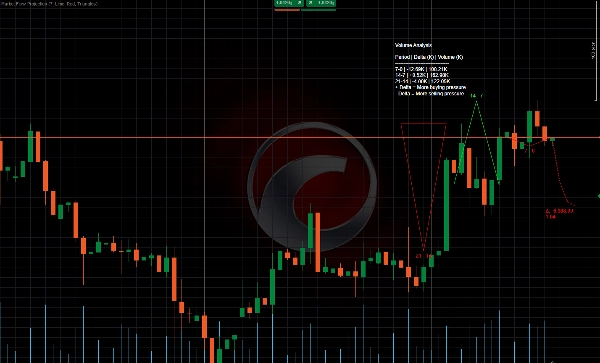
Cet algorithme détermine la probabilité que le prix atteigne un nouveau plus haut ou plus bas et la représente comme un niveau sur le graphique, accompagné de son pourcentage correspondant. Ce calcul est testé rétroactivement, et les résultats sont affichés dans un tableau, ce qui facilite la compréhension de la probabilité que la prochaine bougie établisse un nouveau plus haut ou plus bas. 📈📉
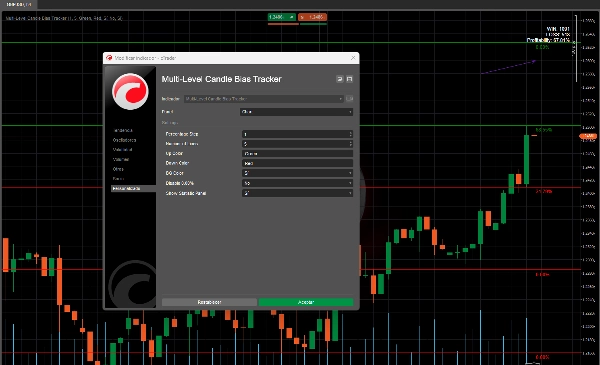
Comment ça fonctionne ? 🛠️
- Probabilités des Nouveaux Plus Hauts et Plus Bas 🎯
-
- L'algorithme analyse le comportement passé des prix pour calculer la probabilité que le prix réalise un nouveau plus haut ou plus bas dans la prochaine bougie.
- Par exemple, si la probabilité d'un nouveau plus haut est de 70 %, il est plus probable que le prix monte. ⬆️
- Niveaux avec Pourcentages 📏
-
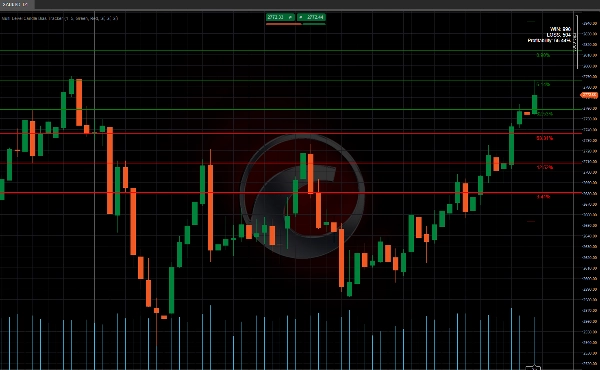
- Il trace des lignes horizontales sur le graphique représentant des niveaux clés, avec un pourcentage indiquant la probabilité que le prix atteigne ce niveau.
- Ces niveaux sont calculés en utilisant un pourcentage que vous définissez (par exemple, 1 %).
- Panneau Statistique 📊
-
- Il montre combien de fois le prix a atteint ces niveaux (succès) et combien de fois il ne l’a pas fait.
- Il fournit également un pourcentage d'efficacité, vous indiquant si ces niveaux ont été fiables dans le passé. ✅❌
À quoi ça sert ?
- Comprendre la direction du prix : Vous aide à savoir si le prix est plus susceptible de monter ou de descendre dans la prochaine bougie. ⬆️⬇️
- Gérer le risque : Si un niveau a une faible probabilité, vous pouvez l’éviter pour réduire les décisions risquées.
Comment l’utiliseriez-vous ?
- Observer les niveaux : Regardez les lignes que l’algorithme trace sur le graphique. 👀
- Vérifier les probabilités : Si un niveau a une probabilité élevée (par exemple, 70 %), il est plus probable que le prix l’atteigne. 📈
- Utiliser le panneau statistique : Vérifiez si ces niveaux ont bien fonctionné dans le passé pour décider si vous leur faites confiance. 📊
Résumé
The indicator includes a statistics panel that shows how many times the price has successfully reached these levels versus how many times it has not, along with an effectiveness percentage reflecting the reliability of these levels based on historical data.
This tool is designed to help traders understand the likely direction of price movement in the next candle and manage risk by avoiding levels with low probabilities. Users apply it by observing the drawn levels, checking their associated probabilities, and reviewing the statistics panel to assess the historical performance of these signals.
Supported markets include commodities, cryptocurrencies (e.g., BTCUSD), and other symbols. The indicator integrates probability-based analysis into price action trading to assist in decision-making regarding potential breakout or trend continuation scenarios.
Avis clients
5 | 100 % | |
4 | 0 % | |
3 | 0 % | |
2 | 0 % | |
1 | 0 % |


![Logo de "[Stellar Strategies] Inside Bar with Signals"](https://cdn.ctrader.com/image/webp/1d9e8bfa-3b2c-4440-bb37-5856902008a7_30683)

