
Mô tả
Dự Báo Giá Động 📈🔮
https://chartshots.spotware.com/c/69d5304ea1cc1
Nó là gì?
https://chartshots.spotware.com/c/69d52fb4b01cd
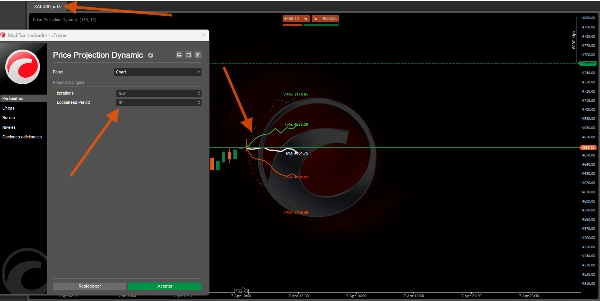
Dự Báo Giá Động là một chỉ báo phủ lên biểu đồ dự đoán các đường giá tương lai có xác suất thống kê cao sử dụng mô phỏng Monte Carlo và đánh giá xu hướng thông qua bộ phân loại xác suất Bayesian. Nó trả lời một câu hỏi: dựa trên cách tài sản này đã di chuyển, nó có khả năng đi đâu tiếp theo theo thống kê? 📊
https://chartshots.spotware.com/c/69d53010d38ce
Cách hoạt động ⚙️
Bộ máy 1 — Dự báo Monte Carlo 🎲
Chỉ báo phân tích lịch sử giá gần đây và trích xuất lợi nhuận theo logarit. Nó tính toán lợi nhuận trung bình và độ lệch chuẩn của nó — ghi nhận cả xu hướng (khuynh hướng) và biến động (chuyển động thất thường) 🌪️.
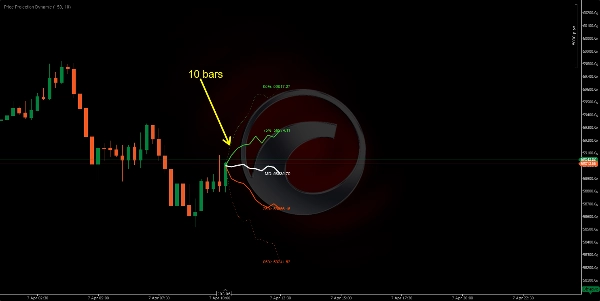
Nó chạy 200 đường giá mô phỏng (tối đa 500) vào tương lai. Mỗi mô phỏng là một "đi bộ ngẫu nhiên" dựa trên hành động thực tế gần đây. Từ đó, chỉ báo trích xuất 5 dải phần trăm:
Dải
Ý nghĩa
95%
Cực kỳ lạc quan — chỉ 5% mô phỏng cao hơn 🚀
75%
Phạm vi có khả năng cao — giá kết thúc trên mức này trong 25% mô phỏng 📈
50% (MD)
Dự báo trung vị — trung tâm thống kê của tất cả kết quả 🎯
25%
Phạm vi có khả năng thấp — giá kết thúc dưới mức này trong 25% mô phỏng 📉
05%
Cực kỳ bi quan — chỉ 5% mô phỏng thấp hơn 📉🛑
Mẹo chuyên nghiệp: Quạt càng mở rộng rộng, biến động hiện tại càng cao 📢. Quạt chặt nghĩa là tài sản di chuyển có thể dự đoán được 🧵.
Bộ máy 2 — Bộ phân loại Bayesian 🧠
Độc lập với dự báo, bộ máy này phân loại thị trường là tăng giá hay giảm giá bằng cách:
- Nhìn lại trong một khoảng thời gian (mặc định 500 thanh) 🔍.
- Đo lường khối lượng tương đối và đà cho các thanh tăng so với giảm.
- Tính toán thanh hiện tại phù hợp hơn với hồ sơ nào bằng xác suất Gaussian ⚖️.
Kết quả là một tỷ lệ phần trăm xác suất thắng:
Xác suất
Giải thích
> 70%
Độ tin cậy cao về xu hướng tăng ✅🟢
50–70%
Trung bình / không rõ ràng ⚖️🟡
< 30%
Độ tin cậy cao về xu hướng giảm ✅🔴
Yếu tố trực quan 🎨
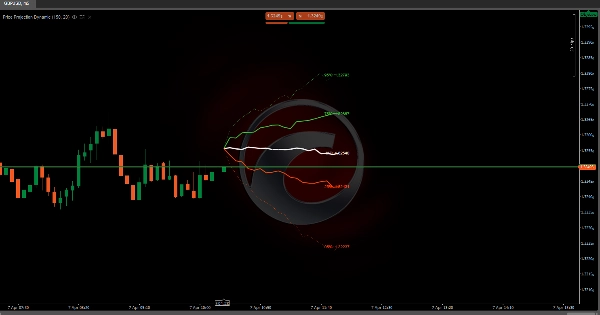
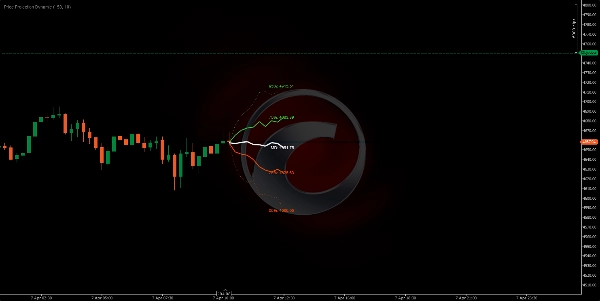
- Đường màu xanh lá (75%, 95%): Dải dự báo trên — phạm vi tăng giá 🍏
- Đường màu trắng (MD): Giá dự báo trung vị — đường đi có xác suất cao nhất 🏁
- Đường màu cam (25%, 05%): Dải dự báo dưới — phạm vi giảm giá 🍊
- Đường chấm ngoài cùng: Cực trị 95% và 05% (ranh giới xác suất thấp) ⚠️
- Đường liền trong cùng: 75%, 50%, 25% (vùng xác suất cao) ✅
- Nhãn giá: Giá dự báo chính xác cho mỗi phần trăm 🏷️
- Bảng thông tin (góc trên bên phải): Xác suất thắng Bayesian, mục tiêu trung vị, khối lượng tương đối, hướng tín hiệu 🖥️
Cách sử dụng 📖
- Đọc hình dạng quạt 📢 — Nếu nó mở rộng nhanh, biến động cao và dự báo kém chắc chắn hơn.
- Sử dụng đường trung vị (MD) 🎯 làm mục tiêu giá tương lai có xác suất thống kê cao nhất.
- Sử dụng dải 75%/25% 📏 làm mục tiêu trên/dưới thực tế cho giao dịch.
- Sử dụng dải 95%/05% 🛑 làm ranh giới cực đoan — hữu ích để đặt điểm dừng lỗ.
- Kiểm tra bảng Bayesian 🧠 — Xác suất trên 70% hoặc dưới 30% tăng độ tin cậy hướng đi.
- Kết hợp cả hai bộ máy 🤝 — Nếu đường trung vị dốc lên VÀ xác suất Bayesian > 70%, thiết lập có sức mạnh thống kê.
Các tham số chính ⚙️
Tham số
Điều khiển gì
Giá trị cao hơn
Giá trị thấp hơn
Số lần lặp
Số đường mô phỏng
Dải mượt hơn 🌊
Tính toán nhanh hơn ⚡
Khoảng nhìn trước
Khoảng cách dự báo tương lai
Tầm nhìn dài hơn 🔭
Ngắn hơn, đáng tin cậy hơn 🔍
Độ sâu mẫu
Các thanh gần đây để phân tích
Hành vi dài hạn 🐢
Chỉ hành vi gần đây 🐇
Cửa sổ phân loại
Lịch sử Bayesian
Xác suất ổn định hơn ⚖️
Phản ứng nhanh hơn ⚡
Hồ sơ chỉ báo 📋
- Loại chỉ báo: Thống kê 📊
- Loại đầu ra: Hình ảnh & Tín hiệu 🖼️
- Yêu cầu dữ liệu: Chỉ thanh 📶
Tuyên bố từ chối trách nhiệm ⚠️
Chỉ báo này dự báo xác suất thống kê, không phải dự đoán 🔮. Mô phỏng Monte Carlo giả định tương lai sẽ giống quá khứ gần đây — điều này sẽ không đúng trong các sự kiện thiên nga đen 🦢 hoặc các khoảng trống do tin tức gây ra. Sử dụng như một khung xác suất cùng với quản lý rủi ro của riêng bạn 🛡️.
Tóm tắt
Separately, the Bayesian classifier evaluates market sentiment by analyzing relative volume and momentum over a configurable window, providing a win probability percentage that indicates bullish or bearish confidence. Visual elements include color-coded projection bands (green for bullish, orange for bearish), a median price line, price labels for each percentile, and an info panel displaying Bayesian probability and other metrics.
Key adjustable parameters include the number of simulation iterations, projection horizon, sample depth of historical bars, and classifier window size. The indicator requires bar data with volume and outputs visual projections and directional signals. It is designed to offer a probabilistic framework for anticipating price movement based on recent market behavior, suitable for various symbols including BTCUSD, EURUSD, GBPUSD, XAUUSD, NAS100, and others.
Đánh giá của khách hàng
5 | 0 % | |
4 | 100 % | |
3 | 0 % | |
2 | 0 % | |
1 | 0 % |


