

present
Inscrivez-vous et bénéficiez d'une remise de 50 $ sur votre premier achat
Trading product for MyZTrade High TF candle v1.0 Indicateur Inside Bar Engulfing, image 1
MyZTrade High TF candle v1.0
Indicateur
Version 1.0, Aug 2026
Windows, Mac
Trading product for MyZTrade High TF candle v1.0 Indicateur Inside Bar Engulfing, image 2
Depuis le 28/06/2025

Description

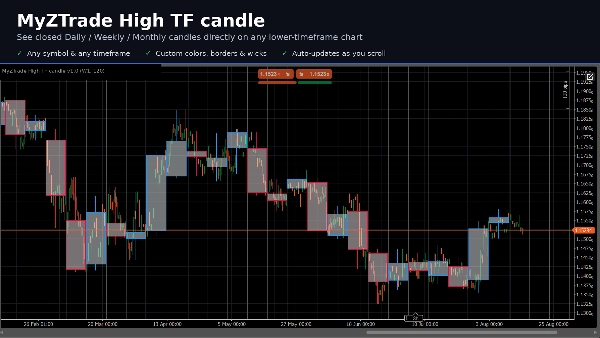
MyZTrade High TF candle est un outil de visualisation multi-échelle qui superpose les chandeliers de timeframe supérieur terminés (Journalier, Hebdomadaire ou Mensuel — sélectionnable) directement sur votre graphique actuel sous forme de boîtes colorées avec un corps, une bordure et des mèches haut/bas, similaire à voir une bougie D1 ou W1 sans changer de graphique.

Seules les bougies de timeframe supérieur fermées sont dessinées. La bougie encore en formation est intentionnellement ignorée, de sorte qu'une boîte ne change jamais de forme tant que sa période est encore ouverte — elle n'apparaît qu'une fois la période complètement clôturée.

Type d'indicateur : superposition multi-échelle / outil de contexte d'action des prix. Fonctionne sur n'importe quel symbole et n'importe quelle timeframe inférieure (par ex. M15, H1, H4).

Caractéristiques principales :

  • La timeframe supérieure est sélectionnable : Journalier, Hebdomadaire ou Mensuel
  • Le nombre de boîtes visibles est configurable, afin que la charge du graphique reste maîtrisée sur de longues historiques
  • Couleurs de remplissage et de bordure séparées pour les bougies haussières et baissières
  • Mèches haut/bas optionnelles sur chaque boîte
  • Redessine automatiquement lorsque vous faites défiler le graphique

Cas d'utilisation en trading : lire les zones de support/résistance de timeframe supérieur et le biais journalier ou hebdomadaire tout en exécutant sur une timeframe inférieure, et étudier comment le prix se comporte à l'intérieur d'une plage de timeframe supérieur terminée sans changer de graphique en permanence.

Résumé

Résumé IA
MyZTrade High TF candle is a multi-timeframe visualization indicator designed to overlay completed higher-timeframe candles—Daily, Weekly, or Monthly—directly onto a lower timeframe chart (e.g., M15, H1, H4). It displays these higher timeframe candles as colored boxes with distinct bodies, borders, and optional high/low wicks, providing a clear view of higher timeframe price action without switching charts. Only fully closed higher timeframe candles are shown, ensuring that the displayed boxes remain static and do not change shape during the current period. Users can configure the number of visible boxes to manage chart load and customize separate fill and border colors for bullish and bearish candles. The indicator automatically redraws when scrolling the chart. This tool aids traders in identifying higher timeframe support and resistance zones and assessing daily or weekly market bias while executing trades on lower timeframes. It supports any symbol and serves as a price-action context tool for enhanced multi-timeframe analysis.
Profil de l'indicateur

Avis clients

0.0
Avis : 0
Avis clients
Il n'y a pas encore d'avis sur ce produit. Vous l'avez déjà essayé ? Soyez le premier à en parler aux autres !

Discussion

Questions fréquentes

Inside Bar
Engulfing
Fair Value Gap
BOS
Imbalance
CHOCH
Support & Resistance
Les produits disponibles sur cTrader Store, notamment les bots de trading, les indicateurs et les plug-ins, sont fournis par des développeurs tiers et mis à disposition à titre informatif et à des fins d'accès technique uniquement. cTrader Store n'est pas un courtier et ne fournit aucun conseil en investissement, aucune recommandation personnelle ni aucune garantie quant aux performances futures.

Plus de cet auteur

Indicateur
Volume
Key Levels
+4
Margin Zones its CME-based support/resistance levels from price extremes, helps traders spot entries and exits NKZ zones
Indicateur
Channel
Fibonacci
+5
Market maker levels from key price extremes — catch major reversals and corrections in one click. ver1.2
Indicateur
ATR
EMA
+5
The indicator displays potential reversal zones (support/resistance) on the chart based on the average range (High–Low)

Vous pourriez aussi aimer

Indicateur
Prop
Forex
NEW - PNLs as % - daily, weekly, monthly, or yearly & Spread, Time To Close, PNL Alerts, custom Bid / Ask lines
Indicateur
Customize your Moving Average! Choose any timeframe and price source for precision and flexibility in your analysis.
Indicateur
Prop
VWAP
+15
VWAP: Follow the smart money. Trade with real volume and the fair price on your side!
Indicateur
Advanced price action tool that combines multiple technical analysis concepts
Indicateur
ATR
VWAP
+4
Structure-aware indicator that re-anchors VWAP to confirmed swing pivots.
Indicateur
The long awaited new and improved Supply Demand Premium V2 indicator. Unlock greater trading opportunities now!
Indicateur
Breakout
Institutional Flow Radar scans the chart for abnormal volume events and classifies them into two groups: Capital &Public
Indicateur
Prop
Forex
+10
Support and Resistance Line Indicator with Higher Timeframe Filter
Indicateur
AI
SMC
+17
Smart Support/Resistance lines auto calculated from D1/H4/H1/M15. Highly customizable visuals + built in Backtest Mode.
Indicateur
Prop
Forex
+5
Traders Panel: Scan 15 pairs across 5 timeframes. Live heatmap, strength rankings and best setups in one panel.
Indicateur
BOS
Key Levels
+1
Guided by Yahuah Yahusha. 15M: BOS above red (buys)/below green (sells). 4HC reject+BOS. 5M: RBS/SBR. SL wick. TP 1:4.
Indicateur
AI
Grid
+17
Clean 3D, Sleek Candles for Trend Patterns.
Indicateur
Key Levels
Order Block
+5
Pixel-perfect trading zones in a click! Instantly draw, resize & color via hotkeys. Automate your charting routine
Indicateur
RSI
MACD
+1
Precision Supply & Demand zones indicator—automatically plots key buy/sell areas on your chart for smarter entries.
Indicateur
ATR
Forex
+6
It combines swing (pivot-based) market structure detection with Gann Fan geometry and Fibonacci retracement/extension
Indicateur
BOS
MSS
+5
Your entire ICT session map, structure engine, and key levels — No manual work. One indicator. Every session!
Indicateur
AI
Grid
+9
Pivot Point MultiTimeFrame with Order Block
Indicateur
AI
Prop
+7
EMA Clouds, Multi-Timeframe (MTF) Overlay, Swing High/Low detection, and a smart Dashboard with neutral zone filtering.

Prix

Depuis le 28/06/2025



















