
คำอธิบาย
ตัวชี้วัด Pinescriptlabs Store: 🤖Pinescriptlabs Store cBots :
ICT Power of 3 (cBot) Gold & BTC BreakoutSession Pivots(ใหม่)YieldShield"
SmartTrend Support &
เส้นแนวต้าน
Dynamic Market Structure
การวิเคราะห์จุดเปลี่ยน
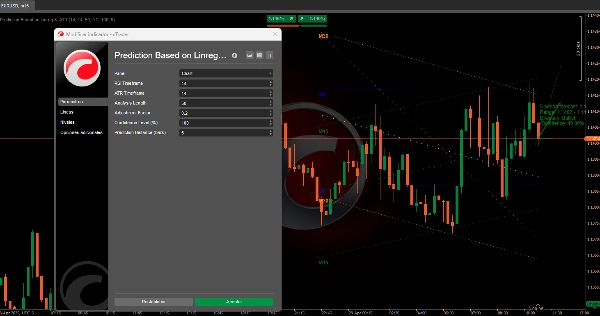
Fibonacci Linear
Regression Multi-timeframe
Multi-Level Candle Bias
Tracker
Auto Support and
เส้นแนวโน้มแนวต้าน
📈 ช่องรีเกรสชันหลายกรอบเวลา & อัลกอริทึมการทำนาย ATR
ระบบนี้ทำนายการเคลื่อนไหวของราคาสินทรัพย์โดยรวม การวิเคราะห์แนวโน้มหลายกรอบเวลา 📊, ความผันผวนของตลาด 📉, และการยืนยันตัวชี้วัดทางเทคนิค ✅ เป้าหมายคือการคาดการณ์ ช่วงราคาที่จะเกิดขึ้นในอนาคต ด้วยความมั่นใจที่วัดได้ เหมาะสำหรับการระบุ โอกาสความเสี่ยง-ผลตอบแทนที่มีความน่าจะเป็นสูง 💰.
🔧 วิธีการทำงานทีละขั้นตอน
1️⃣ การวิเคราะห์แนวโน้มหลายกรอบเวลา
- ช่องรีเกรสชันข้ามกรอบเวลา:
อัลกอริทึมวิเคราะห์พร้อมกัน สี่กรอบเวลาที่แตกต่างกัน (ตั้งแต่ระยะสั้นถึงระยะยาว) สำหรับแต่ละกรอบเวลา: -
- คำนวณ เส้นแนวโน้มทางสถิติ โดยอิงจากพฤติกรรมราคาที่ผ่านมา
- กำหนด ช่องทางการทำนาย รอบเส้นนี้ (ใช้ความผันผวนในอดีตเพื่อกำหนดขอบบน/ล่าง)
- อิทธิพลแบบลำดับชั้น:
กรอบเวลาที่สั้นกว่าจะมี น้ำหนักมากกว่า ในทิศทางสุดท้าย สะท้อนความไวต่อการเคลื่อนไหวล่าสุด
2️⃣ การผนวกความผันผวน (ATR) 🌊
- การปรับความผันผวนแบบไดนามิก:
การทำนายปรับให้เข้ากับสภาพตลาดปัจจุบัน: -
- ความผันผวนสูง → การทำนายกว้างขึ้น
- ความผันผวนต่ำ → การปรับแบบระมัดระวัง
- การปรับขนาดช่วงในอนาคต:
แถบการทำนาย ปรับโดยอัตโนมัติ ตามความผันผวนที่คาดการณ์ไว้
3️⃣ ระบบยืนยันแนวโน้ม ✅
รวม สัญญาณสำคัญสี่อย่าง เพื่อยืนยันหรือท้าทายทิศทางที่อิงรีเกรสชัน:
- การตัดกันของค่าเฉลี่ยเคลื่อนที่ (ยืนยันแนวโน้ม)
- ออสซิลเลเตอร์โมเมนตัม (ประเมินความแข็งแกร่ง)
- ตัวชี้วัดความผันผวน (ตรวจจับภาวะซื้อมาก/ขายมากเกินไป)
- การวิเคราะห์ความแตกต่าง (เบาะแสการกลับตัวของแนวโน้ม)
- ผลลัพธ์: ระบบการให้คะแนน ที่เสริมสร้างหรือท้าทายแนวโน้มที่ทำนายไว้.
4️⃣ การคำนวณความมั่นใจ 🎯
- การจัดแนวกรอบเวลา:
ความมั่นใจเพิ่มขึ้นเมื่อแนวโน้ม สอดคล้องกันในหลายกรอบเวลา. - เกณฑ์ที่กำหนดโดยผู้ใช้:
ผู้เทรดสามารถตั้ง ระดับความมั่นใจขั้นต่ำ เพื่อกรองเฉพาะสัญญาณที่มีความแน่นอนสูง
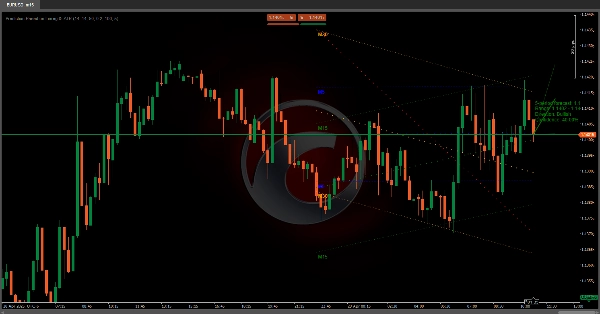
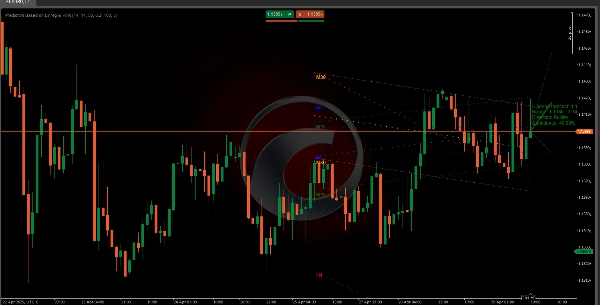
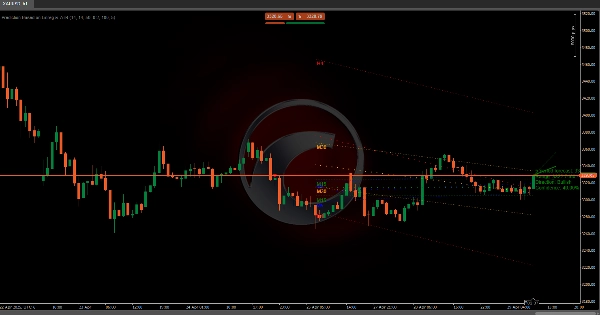
5️⃣ การแสดงผลที่เข้าใจง่าย 📉📈
- เส้นทำนาย:
แสดง เส้นทางคาดหวังกลาง (สีเขียว = ขาขึ้น 🟢, สีแดง = ขาลง 🔴, สีเทา = เป็นกลาง ⚪) - แถบช่วง:
เน้น โซนการเคลื่อนไหวของราคาที่น่าจะเป็นไปได้มากที่สุด ปรับตามความผันผวน - ป้ายข้อมูล:
สรุป ราคาที่คาดการณ์ ช่วง ทิศทาง และระดับความมั่นใจ.
🌟 ข้อได้เปรียบหลัก
- แนวทางหลายมิติ: รวม แนวโน้ม ความผันผวน & โมเมนตัม เพื่อลดสัญญาณผิดพลาด
- ปรับตัวเองได้: ปรับให้เข้ากับ ตลาดที่ผันผวนหรือมีแนวโน้ม โดยอัตโนมัติ
- เมตริกโปร่งใส: ความมั่นใจที่วัดได้ช่วยจัดการความคาดหวัง
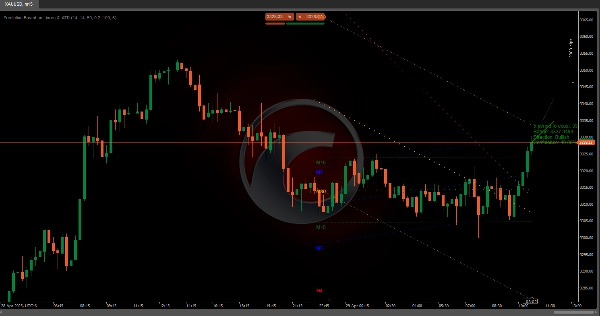
📌 ตัวอย่างการใช้งานจริง
ถ้าระบบตรวจพบ:
- แนวโน้มขาขึ้นในกรอบเวลาสั้น + การยืนยันโมเมนตัม
- ความผันผวนล่าสุดต่ำ
- ความเห็นพ้องของกรอบเวลาที่แข็งแกร่ง
→ คาดการณ์ราคาขาขึ้นพร้อมแถบแคบและความมั่นใจสูง (เช่น 85%) 🚀
สรุป
The ATR component dynamically adjusts the prediction bands to current market conditions, widening during high volatility and narrowing during low volatility periods. A trend confirmation system integrates four key signals—moving average crosses, momentum oscillators, volatility indicators, and divergence analysis—to validate or question the regression-based trend, producing a scoring system that indicates trend strength.
Confidence levels are calculated based on alignment of trends across timeframes, with user-configurable thresholds to filter signals by certainty. Visualization includes a central prediction line (color-coded for bullish, bearish, or neutral trends), range bands highlighting probable price zones, and an info label summarizing projected price, range, direction, and confidence.
The indicator supports markets including cryptocurrencies (e.g., BTCUSD), commodities (e.g., XAUUSD), and others. It aims to identify high-probability risk-reward opportunities by combining trend, volatility, and momentum analysis in a self-adjusting, transparent framework.


