


Описание
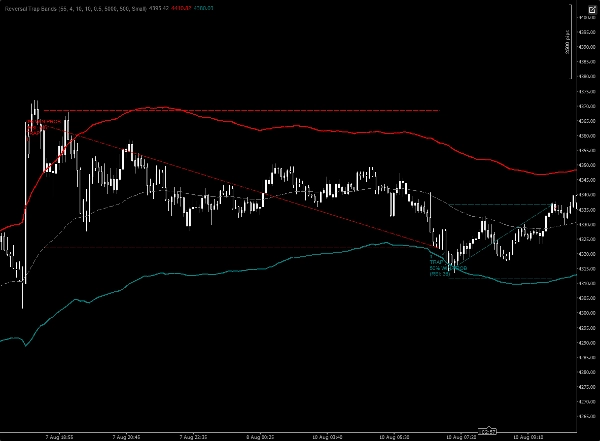
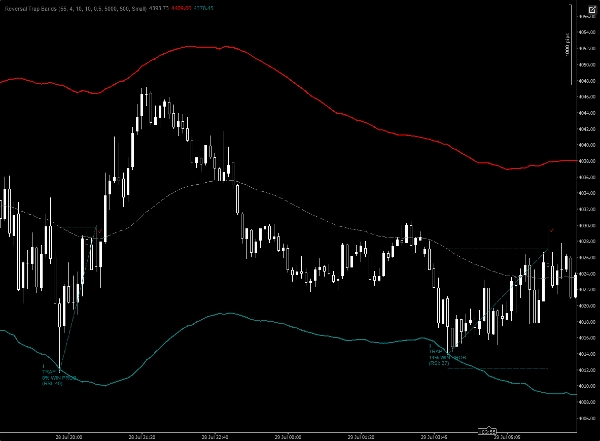
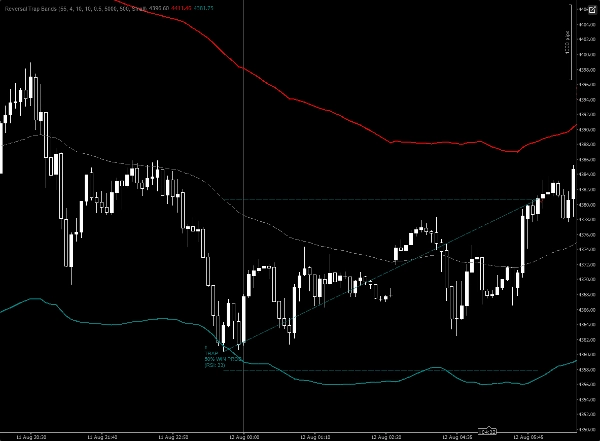
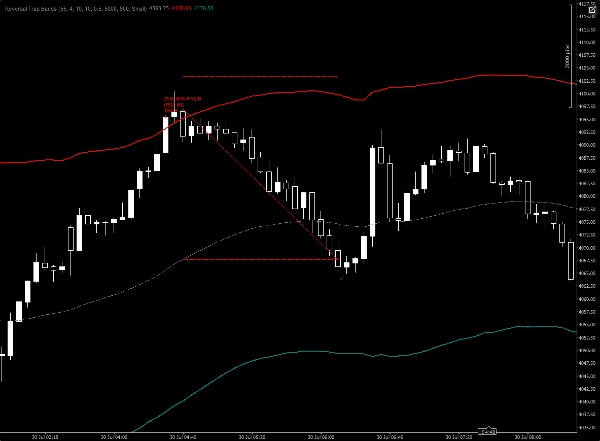
Полосы вероятности ловушек разворота — это инструмент самонастраивающегося обнаружения разворотов, построенный вокруг адаптивной к волатильности ценовой оболочки. Вместо того чтобы просто отмечать каждое касание внешних полос, он специально ищет «ложные» ловушки — ситуации, когда цена выходит за пределы оболочки, не удерживается и возвращается обратно внутрь — которые часто являются более вероятными точками разворота, чем простое касание полосы.
Что отличает этот индикатор, так это встроенный статистический движок. Каждый раз, когда срабатывает сигнал ловушки, индикатор классифицирует его по рыночному условию и тихо отслеживает, достигла ли такая установка своей цели или была остановлена. Со временем он формирует живой показатель вероятности для каждого условия и отображает этот коэффициент выигрыша непосредственно на графике при следующем появлении похожей установки — так что вы видите не просто сигнал, а то, как аналогичные сигналы исторически показывали себя на этом конкретном инструменте и таймфрейме.
Для каждой обнаруженной ловушки индикатор отображает:
- Направленный сигнал, отмечающий разворот
- Проектируемый уровень цели
- Защитный уровень стопа
- Текущий показатель вероятности выигрыша для этого типа установки
По мере развития цены индикатор автоматически отслеживает, был ли сначала достигнут уровень цели или стопа, обновляет свою внутреннюю базу данных и уточняет будущие показатели вероятности — превращая график в постоянно обновляющуюся запись о том, насколько надежны эти ловушки разворота на самом деле.
Он предназначен для трейдеров, которые хотят получать сигналы разворота, подкрепленные доказательствами, а не статической формулой — идеально подходит для торговли против истощения движения, ловли стоп-лоссов и тайминга входов в периоды экстремальной волатильности на любом рынке и таймфрейме.
Сводка
Key features include a self-learning statistics engine that classifies each trap by market condition and tracks its outcome (target hit or stop triggered). This ongoing analysis generates a live probability score for similar setups, displayed directly on the chart to inform decision-making based on historical performance for the current instrument and timeframe.
For each detected trap, the indicator plots:
- A directional reversal signal
- A projected target level
- A protective stop level
- A live win-probability readout for that setup type
The indicator continuously updates its internal database as price action unfolds, refining future probability estimates. It supports visualization and reversal, trend strength, and level break signals, operating on bar data across any market and timeframe. This tool is suited for traders seeking evidence-based reversal signals to time entries around volatility extremes and potential stop-hunt scenarios.
Отзывы покупателей
5 | 100 % | |
4 | 0 % | |
3 | 0 % | |
2 | 0 % | |
1 | 0 % |
Обсуждение
Частые вопросы
Больше от этого автора























Цена