
Descripción
VWAP (Precio Promedio Ponderado por Volumen) es un punto de referencia de trading que calcula el precio promedio de un activo ajustado por el volumen de negociación durante un período especificado. Es ampliamente utilizado por operadores diarios, instituciones y sistemas de trading algorítmico para evaluar el valor justo y optimizar la ejecución de operaciones.
Fórmula clave:
VWAP=∑(Price×Volume)/∑Volume
- Precio = Precio típico (Alto + Bajo + Cierre) / 3 o solo precio de cierre.
- Volumen = Volumen de negociación para cada período.
2. ¿Por qué usar VWAP?
Propósito:
1)Referencia de Valor Justo
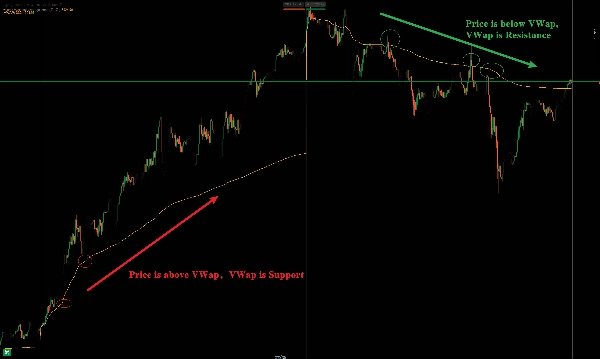
Precio > VWAP = Sesgo alcista; Precio < VWAP = Sesgo bajista.
2)Soporte/Resistencia Dinámicos
Actúa como un nivel clave para rupturas/reversiones intradía.
3) Confirmación de Tendencia
Precio manteniéndose por encima del VWAP = Tendencia alcista; Por debajo = Tendencia bajista.
Explicación detallada y uso del indicador Precio Promedio Ponderado por Volumen (VWAP)
1. Concepto básico
VWAP (Precio Promedio Ponderado por Volumen) es una herramienta de análisis técnico utilizada para medir el precio promedio de negociación de un activo durante un período específico, ponderado por el volumen de negociación. Ayuda a los operadores a juzgar el "valor justo" del precio actual en relación con el mercado, y se usa comúnmente en trading intradía, trading algorítmico y ejecución de órdenes institucionales.
Fórmula principal:
VWAP=∑(Price×Volume)/∑Volume
La suma del precio de cada vela K × volumen de negociación, dividida por el volumen total, para obtener un precio promedio ponderado dinámico.
2. Principales usos del VWAP
Usos:
1)Determinar el precio justo del mercado
Precio por encima del VWAP = Fuerte; por debajo del VWAP = Débil.
2)Referencia de soporte/resistencia
El VWAP suele actuar como soporte/resistencia dinámico para operaciones a corto plazo.
3)Confirmación de tendencia intradía
Precio sostenido por encima del VWAP = Dominio alcista; por debajo = Dominio bajista.
Resumen
VWAP serves several key functions: it acts as a reference for fair value, where prices above VWAP indicate bullish bias and below indicate bearish bias; it provides dynamic support and resistance levels useful for intraday breakouts and reversals; and it helps confirm intraday trends, with prices sustained above VWAP signaling an uptrend and below signaling a downtrend.
This indicator supports various markets including forex, stocks, indices, commodities, and cryptocurrencies, making it a versatile tool for intraday market analysis and trading strategy development.


