
Descripción
Continuación de la Onda-3 de Elliott y Reversiones de Elliott
Estructura de la Onda de Elliott es un indicador diseñado para analizar la estructura del mercado con la teoría de las Ondas de Elliott.
Combina análisis de oscilaciones confirmadas, estructura del mercado, detección de impulsos de Elliott, y una continuación dedicada de la Onda-2 a la Onda-3.
Esta herramienta fue creada para traders que requieren claridad, confirmación y ejecución basada en reglas, no dibujos subjetivos.
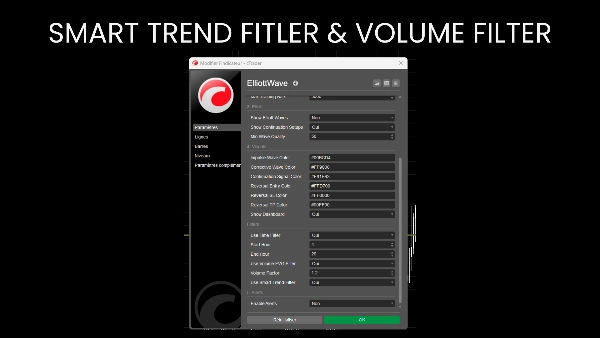
Motor de oscilaciones sin repintado
Todos los cálculos se basan en puntos de oscilación confirmados usando:
- Profundidad de oscilación ajustable
- Desviación mínima de precio (filtro de pips)
- Barras de confirmación
Una vez que se imprime una oscilación, nunca se mueve, asegurando total fiabilidad histórica.
Análisis de la estructura del mercado:
Identifica y etiqueta automáticamente:
- Máximo más alto (HH)
- Mínimo más alto (HL)
- Máximo más bajo (LH)
- Mínimo más bajo (LL)
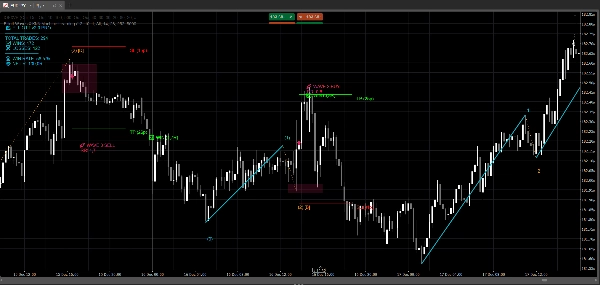
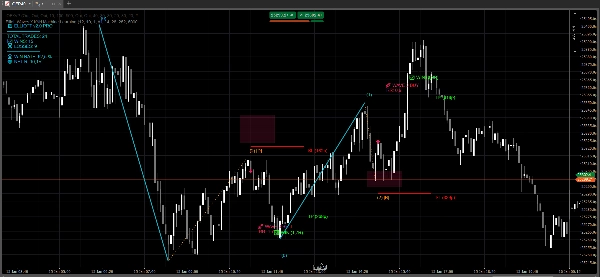
Detección de impulsos de la Onda de Elliott:
El indicador detecta automáticamente impulsos completos de 5 ondas de Elliott en ambas direcciones:
- Alcista: L-H-L-H-L-H
- Bajista: H-L-H-L-H-L
Valida los impulsos usando reglas internas:
- Fuerza de la Onda 3
- Lógica de retroceso de las Ondas 2 y 4
- Proporcionalidad de la Onda 5
Cada impulso se califica usando una puntuación de calidad (0–100) y se etiqueta directamente en el gráfico.
Configuración de continuación de la Onda-3 (Módulo principal de trading)
Este es el componente central de trading del indicador.
El sistema identifica estructuras de continuación de las Ondas 0-1-2 y prepara entradas para la Onda 3:
- Alcista: Mínimo → Máximo → Mínimo más alto
- Bajista: Máximo → Mínimo → Máximo más bajo
Los criterios de validación incluyen:
- Retroceso de la Onda 2 entre 23.6% y 88.6%
- No invalida a través de la Onda 0
- Alineación de tendencia usando la estructura del mercado
- Fuerza de la Onda 1 relativa al ATR
- El precio debe estar sobre OB
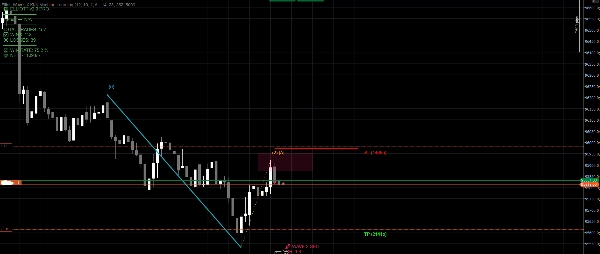
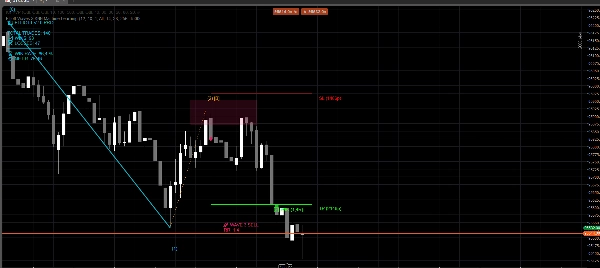
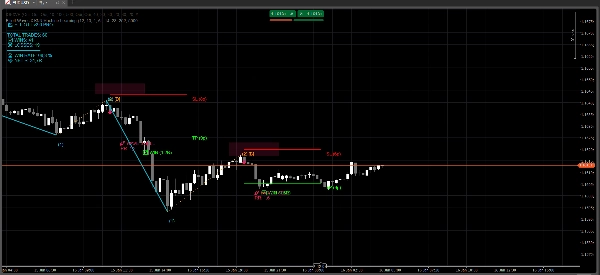
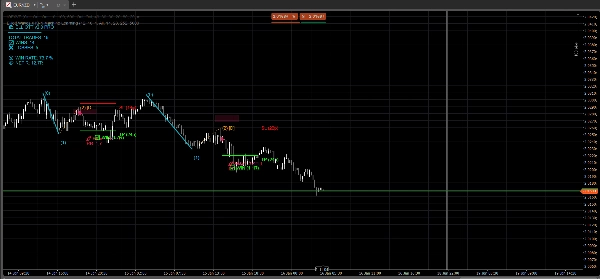
Cuando se valida, el indicador dibuja automáticamente:
- Estructura de las Ondas 1 y 2
- Zona de entrada OB
- Señal de entrada
- Stop Loss basado en ATR más allá de la Onda 2
- Take Profit basado en proyección ATR
Gestión de Riesgo y Operaciones
- Stop Loss y Take Profit se calculan dinámicamente usando ATR
- La relación Riesgo-Recompensa se muestra directamente en el gráfico
- Diseñado para evitar configuraciones sobreextendidas o de baja calidad
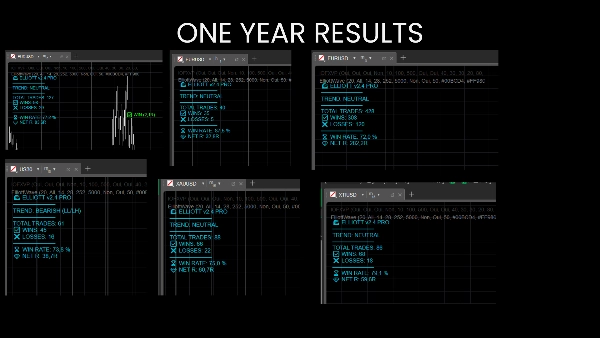
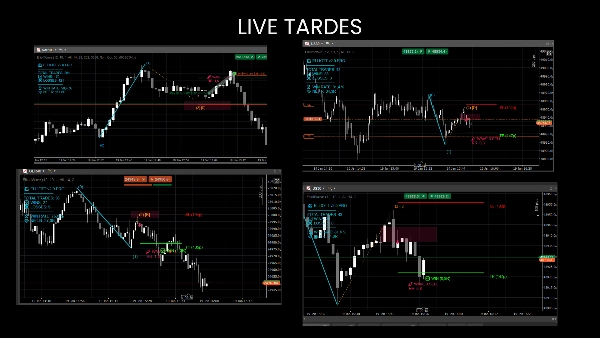
Personalmente lo uso para hacer scalping en índices en M1 y M5, pero también funciona con FX, commodities, acciones, etc... El panel muestra si ha sido rentable en un activo particular.
La versión gratuita te permite probar en los principales FX M15.


