Descripción
Puntos SC MACD
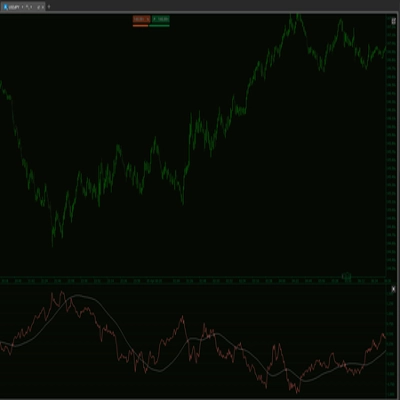
SC MACD Dots es una versión minimalista del clásico indicador MACD, diseñado para proporcionar una vista más limpia e intuitiva del momentum sin saturar el gráfico con barras de histograma tradicionales y múltiples líneas.
En lugar de mostrar el histograma estándar del MACD, el indicador utiliza puntos dinámicos para representar los valores del histograma a lo largo del tiempo. Este enfoque crea un diseño moderno y visualmente eficiente que permite a los traders identificar instantáneamente cambios en el momentum, aceleración de la tendencia y posibles reversiones.
Los puntos adaptan tanto el color como la intensidad según la fuerza del histograma, facilitando el reconocimiento del aumento o disminución del momentum de un vistazo.
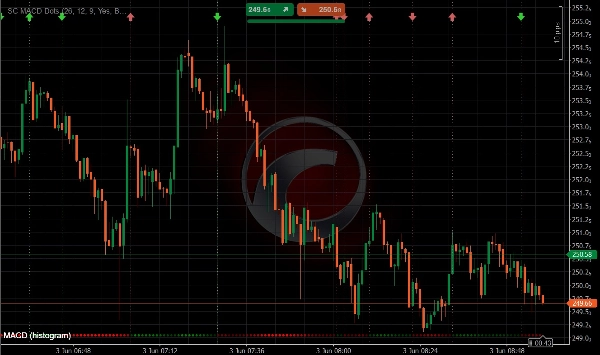
Además, SC MACD Dots resalta automáticamente los cruces de la línea de señal del MACD, permitiendo a los traders identificar rápidamente posibles cambios de tendencia y variaciones en el momentum.
Características Clave
• Histograma mostrado mediante puntos dinámicos en lugar de barras tradicionales
• Apariencia del gráfico más limpia y menos distractora
• El color y la intensidad de los puntos cambian dinámicamente según la fuerza del histograma
• Identificación visual instantánea del aumento y disminución del momentum
• Detección automática de eventos de cruce del MACD
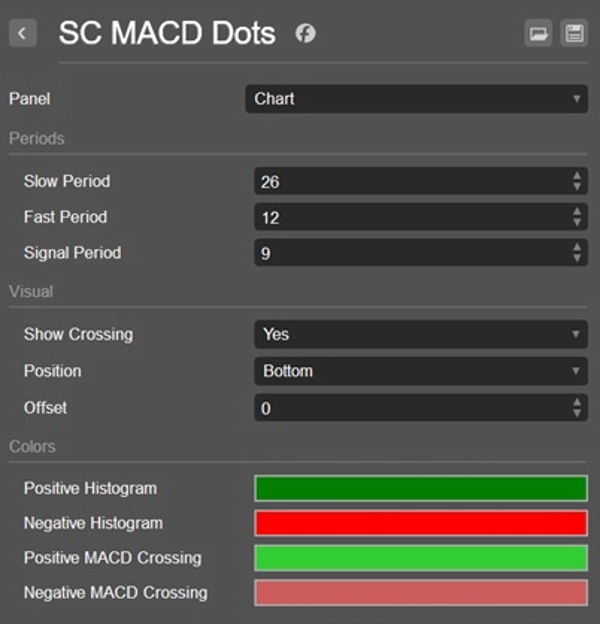
• Colores diferentes para cruces ascendentes y descendentes
• Los cruces en zonas positivas y negativas usan estilos visuales diferentes
• Interpretación visual más rápida de cambios en el momentum y reversiones de tendencia
• Ideal para scalping, trading intradía, swing trading y trading discrecional
Visualización de Cruces
SC MACD Dots resalta cada evento de cruce del MACD:
• Los cruces ascendentes (alcistas) se muestran usando colores dedicados alcistas
• Los cruces descendentes (bajistas) se muestran usando colores dedicados bajistas
• Los cruces que ocurren por encima de la línea cero (territorio positivo del MACD) usan un esquema de color diferente a los que ocurren por debajo de la línea cero (territorio negativo del MACD)
• Esto permite a los traders distinguir instantáneamente entre señales de momentum más fuertes y más débiles
Por Qué Usar SC MACD Dots
Los indicadores MACD tradicionales a menudo requieren que los traders monitoreen múltiples líneas y barras de histograma simultáneamente, lo que puede hacer que los gráficos parezcan saturados y difíciles de leer.
SC MACD Dots fue creado con un objetivo en mente:
simplificar el análisis del MACD mientras se preserva toda la información esencial del momentum.
La visualización adaptativa de puntos permite a los traders evaluar rápidamente la fuerza del histograma, la aceleración y desaceleración del momentum, y las señales de cruce sin la distracción de elementos visuales innecesarios.
Al combinar puntos dinámicos del histograma con una visualización inteligente de cruces, los traders pueden identificar oportunidades más rápido y mantener un espacio de trabajo de trading más limpio.
Perfecto Para
• Traders que prefieren gráficos limpios
• Traders de momentum
• Scalpers y traders intradía
• Swing traders
• Configuraciones de trading con múltiples indicadores
• Análisis rápido del mercado
• Traders que dependen de señales de cruce del MACD
Nota Importante
SC MACD Dots está diseñado para usarse directamente en el gráfico principal de precios.
A diferencia de los indicadores MACD tradicionales, su concepto visual se basa en integrar la información del momentum en el análisis de la acción del precio. Por esta razón, no se recomienda usar el indicador en un panel separado y no proporciona la experiencia de usuario prevista.
Simple. Limpio. Poderoso.
Resumen
Valoraciones de clientes
5 | 100 % | |
4 | 0 % | |
3 | 0 % | |
2 | 0 % | |
1 | 0 % |