Descripción
Pinescritlabs
Indicadores de Ctrader Store: 🤖cBots de Pinescritlabs Ctrader Store:
Sesiones de Brecha de Valor Justo Pivotes de Sesión de Ruptura de Oro y BTC(nuevo)
Estructura Dinámica del Mercado
Análisis de Puntos de Giro
Fibonacci Lineal
Regresión Multitemporal
Brecha de Valor Justo de Momentum
Proyección del Flujo del Mercado
Gradiente de Tendencia Dinámico
Sesgo de Vela Multinivel
Rastreador
Rastreador de Extremos Zig-Zag
Líneas de Tendencia de Soporte y
Resistencia Automáticas
Todos los Niveles de Soporte y
Resistencia
Mapa de Liquidación de Apalancamiento
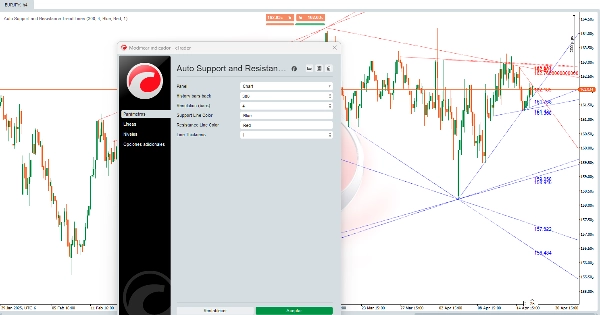
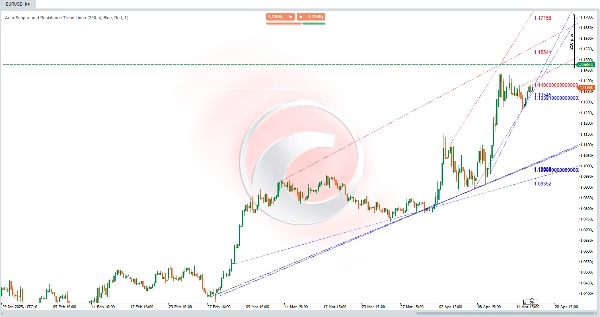
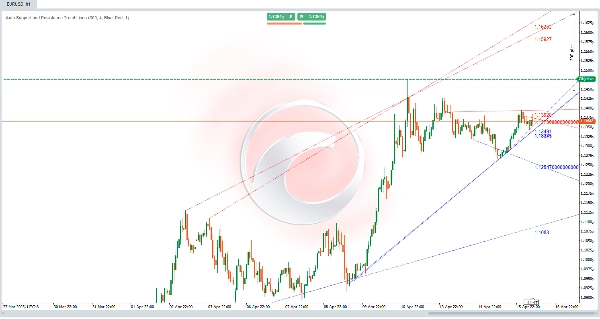
Líneas de Tendencia de Soporte y Resistencia Automáticas:
Este algoritmo es una herramienta poderosa 🛠️ diseñada para identificar automáticamente niveles de soporte y resistencia en un gráfico de precios. No solo dibuja líneas horizontales, sino que también traza canales diagonales ↗️↘️ que representan tendencias del mercado. Estos niveles y canales son áreas clave donde el precio ha tenido dificultades para subir (resistencia 🚧) o bajar (soporte 🛡️), convirtiéndolos en puntos cruciales para decisiones de trading. 📈📉
¿Cómo se realizan los cálculos? 🔍
El algoritmo utiliza un enfoque de análisis del historial de precios 📊 para identificar niveles de soporte y resistencia. Así es como funciona:
- Identificación de Mínimos y Máximos Locales ⬇️⬆️
-
- El algoritmo analiza el precio en un rango específico de barras (velas) para encontrar mínimos locales (los precios más bajos en ese rango) y máximos locales (los precios más altos en ese rango).
- Estos mínimos y máximos locales son candidatos potenciales para convertirse en niveles de soporte y resistencia.
- Validación de Niveles ✔️
-
- Una vez identificados los mínimos y máximos locales, el algoritmo verifica si estos niveles han sido respetados por el precio en el pasado.
- Si el precio ha tocado un nivel varias veces sin romperlo claramente, se considera un nivel válido de soporte o resistencia.
- Dibujo de Líneas y Canales ✏️
-
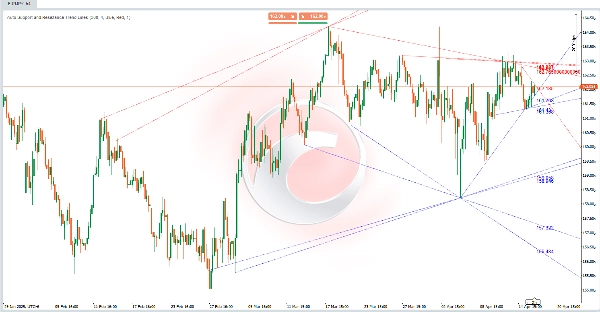
- Los niveles de soporte se dibujan como líneas horizontales (o diagonales) en los mínimos locales validados.
- Los niveles de resistencia se dibujan como líneas horizontales (o diagonales) en los máximos locales validados.
- Además, el algoritmo conecta estos niveles para formar canales diagonales ↗️↘️, que representan tendencias alcistas o bajistas en el mercado.
- Actualizaciones Dinámicas 🔄
-
- El indicador se actualiza automáticamente con cada nueva barra, recalculando y redibujando los niveles de soporte y resistencia basándose en el comportamiento más reciente del precio.
¿Cómo ayuda este algoritmo a los traders? 💡
Este algoritmo es un cambio radical para los traders porque:
- Proporciona una Vista Macro del Mercado 🌐
-
- Al dibujar canales diagonales, el algoritmo muestra las principales tendencias del mercado, ayudando a los traders a identificar si el precio está en una tendencia alcista 📈, tendencia bajista 📉, o un movimiento lateral ↔️.
- Identifica Áreas Clave de Soporte y Resistencia 🎯
-
- Los niveles de soporte y resistencia son zonas donde el precio puede rebotar o romper. Estos niveles son útiles para:
-
- Establecer puntos de entrada y salida para operaciones.
- Colocar stop-loss 🛑 y take-profit ✅ órdenes.
- Identificar rupturas 🚀 o reversiones 🔄 en el precio.
- Simplifica el Análisis Técnico 🕒
-
- El algoritmo automatiza el proceso de identificar soporte y resistencia, ahorrando tiempo a los traders que realizan análisis manual.
- Al mostrar claramente niveles y canales, ayuda a los traders a tomar decisiones más informadas.
- Personalizable 🎨
-
- Los traders pueden ajustar parámetros como el número de barras históricas analizadas, grosor de línea, y colores, permitiendo que el indicador se adapte a diferentes estilos de trading y preferencias visuales.
Ejemplo Práctico 📌
Imagina que estás analizando un gráfico de precios, y el algoritmo ha dibujado:
- Una línea de soporte diagonal ↗️ que conecta varios mínimos locales, indicando una tendencia alcista.
- Una línea de resistencia diagonal ↗️ que conecta varios máximos locales, mostrando un canal ascendente.
- Varias líneas horizontales que representan niveles clave de soporte y resistencia.
Con esta información, puedes:
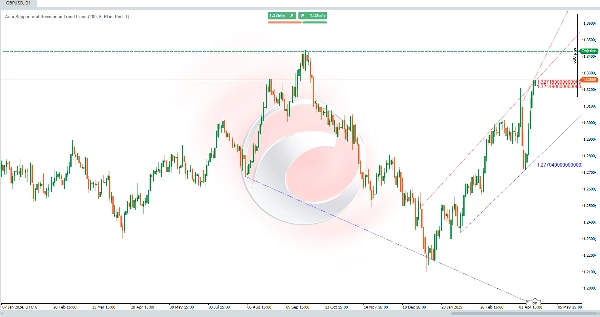
- Identificar que el precio está en una tendencia alcista 📈.
- Buscar oportunidades de compra cerca de la línea de soporte diagonal o de los niveles de soporte horizontales.
- Establecer un stop-loss 🛑 por debajo del nivel de soporte más cercano.
- Observar si el precio rompe la resistencia para confirmar la continuación de la tendencia o una posible reversión 🔄.
Resumen
Once validated, support and resistance levels are drawn as horizontal or diagonal lines, and connected to form channels indicating bullish or bearish trends. The indicator updates dynamically with each new bar, recalculating and redrawing levels to reflect the most recent price behavior.
This tool aids traders by providing a macro view of market trends, identifying zones where price may bounce or break, and simplifying technical analysis through automation. It supports setting entry and exit points, stop-loss and take-profit orders, and spotting potential breakouts or reversals. Parameters such as the number of historical bars analyzed, line thickness, and colors can be customized to fit different trading styles and preferences.