Description
SC RSI Dots
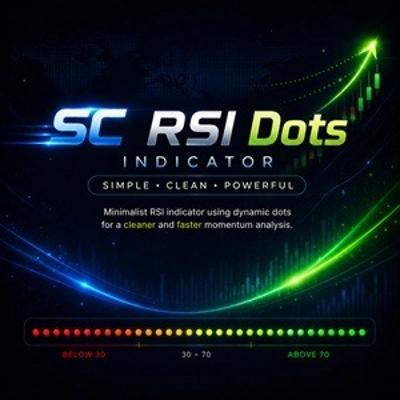
Indicateur RSI minimaliste utilisant des points dynamiques pour une visualisation du momentum plus claire et plus rapide.
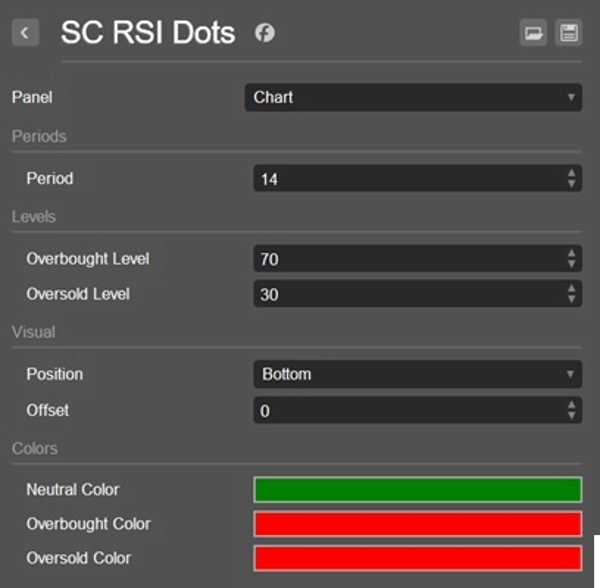
SC RSI Dots est une interprétation minimaliste du RSI classique (Relative Strength Index), conçue pour offrir une vue plus claire et plus intuitive du momentum du marché sans encombrer le graphique avec des lignes inutiles.
Au lieu d'afficher la ligne RSI traditionnelle, l'indicateur utilise des points dynamiques pour représenter les valeurs RSI au fil du temps.
Cette approche crée une disposition de graphique plus propre et plus moderne, plus facile à lire, en particulier pour les traders qui utilisent plusieurs outils simultanément.
Caractéristiques principales
- RSI affiché à l'aide de points au lieu de lignes
- Apparence du graphique plus propre et moins distrayante
- Visualisation dynamique des couleurs basée sur la position du RSI
- Couleur dédiée pour les conditions de survente
- Couleur dédiée pour les conditions de surachat
- Intensité progressive de la couleur à mesure que le RSI approche des niveaux extrêmes
- Identification visuelle instantanée des changements de momentum
- Reconnaissance rapide de la force et de la faiblesse du marché
- Idéal pour le scalping, le trading intrajournalier et le trading discrétionnaire
Comment fonctionne le système de couleurs
SC RSI Dots utilise un moteur de couleur dynamique pour simplifier l'interprétation du RSI.
- Une couleur dédiée identifie les conditions de survente.
- Une couleur dédiée identifie les conditions de surachat.
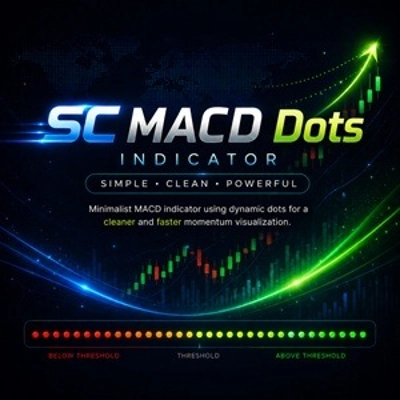
- Entre ces deux zones, l'intensité de la couleur augmente progressivement à mesure que le RSI approche de l'un ou l'autre extrême.
Cette approche visuelle permet aux traders de comprendre instantanément où le momentum se développe sans avoir à surveiller constamment une ligne d'oscillateur traditionnelle.
Le résultat est une lecture plus rapide et plus intuitive des conditions RSI directement à partir du graphique.
Pourquoi utiliser SC RSI Dots
Les indicateurs RSI traditionnels obligent souvent les traders à surveiller en permanence la ligne de l'oscillateur et son interaction avec les niveaux de surachat et de survente.
SC RSI Dots a été créé avec un seul objectif :
garder le graphique visuellement propre tout en fournissant toutes les informations essentielles sur le momentum et les conditions du marché.
La visualisation adaptative par points facilite la reconnaissance de :
- Un momentum haussier croissant
- Un momentum baissier croissant
- L'approche des conditions de surachat
- L'approche des conditions de survente
- Un potentiel épuisement du momentum
Tout cela sans la distraction de lignes supplémentaires à l'écran.
Parfait pour
- Les traders qui préfèrent des graphiques épurés
- Les traders de momentum
- Les traders d'action sur les prix
- Les scalpers et traders intrajournaliers
- Les configurations de trading multi-indicateurs
- Une analyse rapide du marché
Note importante
SC RSI Dots est conçu pour être utilisé directement sur le graphique principal des prix.
Contrairement aux indicateurs RSI traditionnels, son concept visuel est construit autour de l'intégration des informations de momentum dans l'analyse de l'action des prix. Pour cette raison, l'utilisation de l'indicateur dans un panneau séparé n'est pas recommandée et ne fournit pas l'expérience utilisateur prévue.
Simple. Propre. Intuitif.
Résumé
Key features include:
- RSI values represented by dots with dynamic colors reflecting momentum strength.
- Distinct colors for oversold and overbought conditions.
- Progressive color intensity indicating proximity to extreme RSI levels.
- Instant visual cues for momentum shifts, market strength, and weakness.
The indicator is suitable for scalping, intraday, momentum, and price action traders who prefer clean charts and use multiple tools simultaneously. It supports visualization of reversal signals, trend strength, and level touches or breaks based on RSI behavior. SC RSI Dots is intended for use on the main price chart rather than a separate panel, enhancing direct correlation between momentum and price movements.
Discussion
Avis clients
5 | 100 % | |
4 | 0 % | |
3 | 0 % | |
2 | 0 % | |
1 | 0 % |