present
ลงทะเบียนและรับส่วนลด $50 สำหรับการซื้อครั้งแรกของคุณ
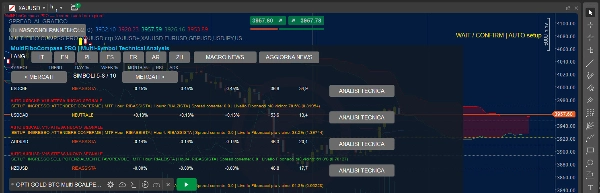
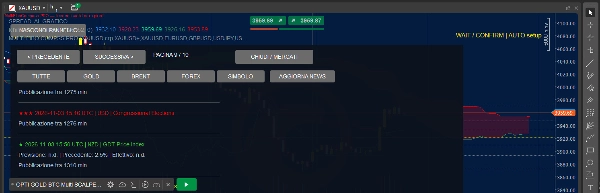
Trading product for MULTI FIBOCOMPAS PRO DEMO  TRIAL Day7 อินดิเคเตอร์ ADX EMA, image 1
MULTI FIBOCOMPAS PRO DEMO TRIAL Day7
อินดิเคเตอร์
เวอร์ชัน 1.0, Nov 2026
Windows, Mac
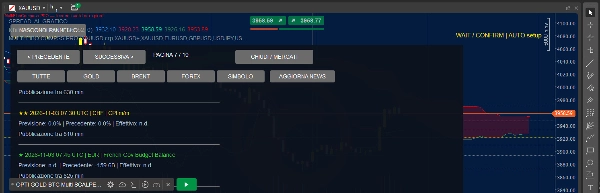
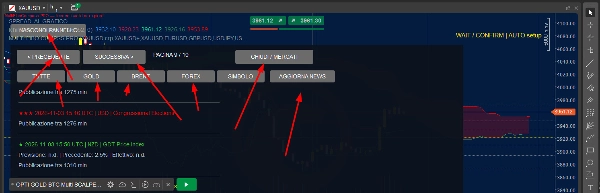
Trading product for MULTI FIBOCOMPAS PRO DEMO  TRIAL Day7 อินดิเคเตอร์ ADX EMA, image 2
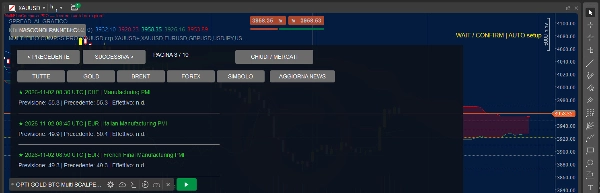
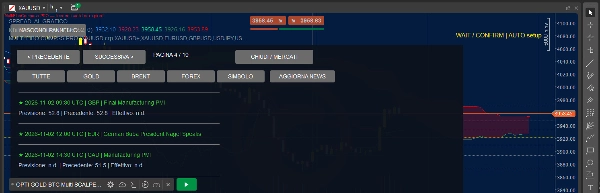
Trading product for MULTI FIBOCOMPAS PRO DEMO  TRIAL Day7 อินดิเคเตอร์ ADX EMA, image 3
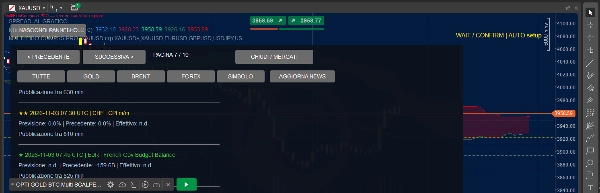
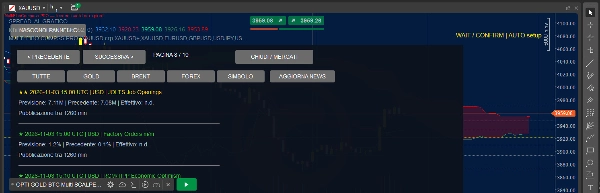
Trading product for MULTI FIBOCOMPAS PRO DEMO  TRIAL Day7 อินดิเคเตอร์ ADX EMA, image 4
Trading product for MULTI FIBOCOMPAS PRO DEMO  TRIAL Day7 อินดิเคเตอร์ ADX EMA, image 5
Trading product for MULTI FIBOCOMPAS PRO DEMO  TRIAL Day7 อินดิเคเตอร์ ADX EMA, image 6
Trading product for MULTI FIBOCOMPAS PRO DEMO  TRIAL Day7 อินดิเคเตอร์ ADX EMA, image 7
Trading product for MULTI FIBOCOMPAS PRO DEMO  TRIAL Day7 อินดิเคเตอร์ ADX EMA, image 8
Trading product for MULTI FIBOCOMPAS PRO DEMO  TRIAL Day7 อินดิเคเตอร์ ADX EMA, image 9
Trading product for MULTI FIBOCOMPAS PRO DEMO  TRIAL Day7 อินดิเคเตอร์ ADX EMA, image 10
Trading product for MULTI FIBOCOMPAS PRO DEMO  TRIAL Day7 อินดิเคเตอร์ ADX EMA, image 11
12
การขาย
1.64K
ติดตั้งฟรี

คำอธิบาย

MULTI FIBO COMPASS PRO – TRIAL 7 DAYS

Advanced Multi-Market Technical Analysis | Professional Trading Dashboard

One Indicator. Multiple Analytical Tools. A Clearer View of the Markets.

MULTI FIBO COMPASS PRO is an advanced technical analysis indicator developed for cTrader, designed for traders who value precision, clarity, and a disciplined approach to financial markets.

Unlike conventional indicators that simply display BUY and SELL signals, MULTI FIBO COMPASS PRO combines multiple technical tools to evaluate market direction, trend strength, momentum, volatility, and potential trading opportunities.

Designed for traders who demand more than just an arrow on a chart.

Advanced Multi-Factor Technical Analysis

MULTI FIBO COMPASS PRO integrates several widely recognized technical indicators:

  • EMA 50 & 200: Identify market direction and underlying trend structure.
  • RSI: Evaluate momentum and potential overbought or oversold conditions.
  • MACD: Assess directional momentum and trend confirmation.
  • ADX: Measure trend strength and identify trending market conditions.
  • ATR: Monitor volatility and changing market dynamics.
  • Fibonacci Retracements: Identify potential retracement levels and areas of technical interest.
  • Support & Resistance: Highlight important price zones.
  • Multi-Timeframe Analysis: Compare market direction across different timeframes for additional confirmation.

By combining these analytical components, the indicator provides a more comprehensive technical perspective without relying on a single signal.

Professional Multi-Market Dashboard

Monitor multiple financial instruments through one organized and intuitive dashboard.

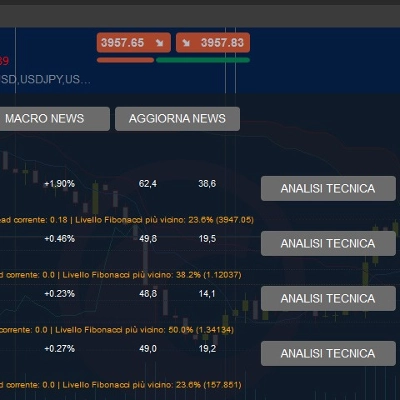
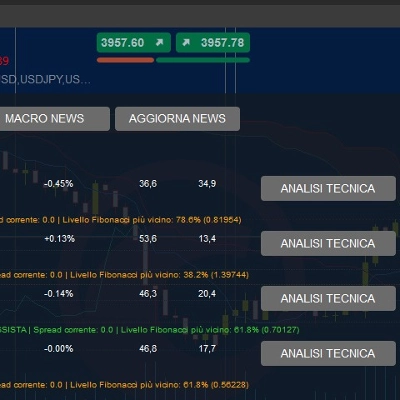
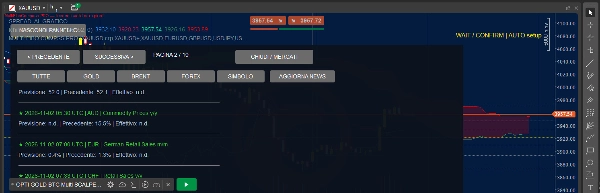
The interface provides essential information, including market trends, daily, weekly and monthly performance, RSI, ADX, and technical conditions.

Supported instruments may include:

XAUUSD (Gold), EURUSD, GBPUSD, USDJPY, AUDUSD, and other financial instruments available through your broker.

Symbol availability depends on your broker and cTrader configuration.

Detailed Technical Analysis

Dedicated analysis controls allow traders to examine individual instruments in greater detail.

The indicator provides structured technical assessments to help distinguish between potentially favorable market conditions and situations where additional confirmation may be necessary.

Rather than attempting to predict future prices with certainty, MULTI FIBO COMPASS PRO focuses on delivering meaningful technical information to support informed trading decisions.

Integrated Macroeconomic Calendar

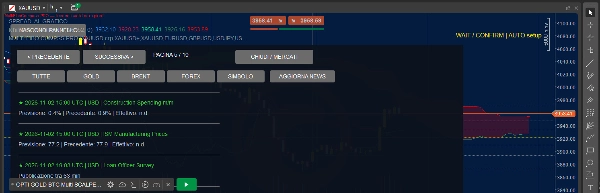
The built-in MACRO NEWS section provides access to economic events and relevant market information.

Events are organized according to their potential impact, helping traders remain aware of important economic announcements.

News availability, accuracy, and update frequency depend on the external data providers.

Customizable and Multilingual Interface

MULTI FIBO COMPASS PRO features an organized dashboard, individual market analysis, customizable display settings, and the ability to hide the panel for a cleaner trading chart.

Multiple language options are available to support an international trading audience.

Free 7-Day Trial

Experience MULTI FIBO COMPASS PRO before purchasing the full version.

The TRIAL edition provides seven days of access to explore the indicator's analytical capabilities.

The trial period begins upon first activation, with activation details, expiration date, and remaining time displayed directly on the chart.

Once the seven-day trial expires, the DEMO version stops operating.

Who Is MULTI FIBO COMPASS PRO Designed For?

This indicator is particularly suitable for:

  • Experienced traders who rely on multiple technical confirmations.
  • Discretionary traders seeking structured market analysis.
  • Technical analysts monitoring several financial instruments.
  • Gold and Forex traders evaluating momentum, volatility, and market trends.
  • Professional and detail-oriented users who prefer comprehensive technical information over isolated trading signals.

Why Choose MULTI FIBO COMPASS PRO?

Because professional trading analysis requires more than a single indicator.

MULTI FIBO COMPASS PRO brings together trend analysis, momentum indicators, Fibonacci levels, volatility measurements, multi-timeframe confirmation, and macroeconomic information within one integrated environment.

Its purpose is to help traders analyze markets more efficiently, recognize changing technical conditions, and approach their trading decisions with greater awareness.

MULTI FIBO COMPASS PRO

More Analysis. More Clarity. Better-Informed Trading Decisions.

Risk Disclaimer

MULTI FIBO COMPASS PRO is a technical analysis tool and does not guarantee profitable trading results. Signals and market assessments are provided for informational purposes only and do not constitute financial advice or investment recommendations.

Trading financial instruments involves significant risk, including the potential loss of invested capital. Users should apply appropriate risk management and independently evaluate all trading decisions.

สรุป

สรุปโดย AI
MULTI FIBO COMPASS PRO is an advanced technical analysis indicator designed for the cTrader platform, offering a comprehensive multi-market trading dashboard. It integrates multiple widely used technical tools—including EMA (50 & 200), RSI, MACD, ADX, ATR, Fibonacci retracements, and support & resistance levels—to provide a multi-factor evaluation of market direction, trend strength, momentum, volatility, and potential trading opportunities. The indicator supports multi-timeframe analysis, allowing traders to compare market conditions across different timeframes for enhanced confirmation.

The dashboard enables monitoring of multiple financial instruments such as XAUUSD (Gold), EURUSD, GBPUSD, USDJPY, and AUDUSD, depending on broker availability. It features dedicated panels for detailed technical assessments and includes an integrated macroeconomic calendar highlighting economic events by their potential market impact.

The interface is customizable and multilingual, designed to organize essential market data clearly while allowing users to hide the panel for a cleaner chart view. This tool is suited for experienced, discretionary, and technical traders who require structured, multi-dimensional market analysis rather than simple buy/sell signals.

A free 7-day trial version is available to explore its analytical capabilities. The indicator provides technical information to support informed trading decisions but does not guarantee trading profits.

โปรไฟล์อินดิเคเตอร์

การสนทนา

รีวิวจากลูกค้า

0.0
รีวิว: 0
รีวิวจากลูกค้า
ยังไม่มีรีวิวสำหรับผลิตภัณฑ์นี้ หากเคยลองแล้ว ขอเชิญมาเป็นคนแรกที่บอกคนอื่น!

คำถามที่พบบ่อย

ADX
EMA
RSI
ATR
Support & Resistance
ผลิตภัณฑ์ที่มีให้บริการผ่าน cTrader Store รวมถึงบอทการเทรด อินดิเคเตอร์ และปลั๊กอิน มีให้บริการโดยนักพัฒนาบุคคลที่สามและมีไว้เพื่อวัตถุประสงค์ในการเข้าถึงข้อมูลและทางเทคนิคเท่านั้น cTrader Store ไม่ใช่โบรกเกอร์และไม่ได้ให้คำแนะนำการลงทุน คำแนะนำส่วนบุคคล หรือการรับประกันผลการดำเนินงานในอนาคต

เพิ่มเติมจากผู้เขียนคนนี้

cBot
Grid Recovery
Advanced institutional grid trading for Gold with trend detection, recovery, and reverse trading modes Trial DAY7
1.56
อัตราส่วน กำไรต่อขาดทุน
cBot
Forex
EURUSD
+2
MatrixGridSentinel Live
8.8%
ROI
1.79
อัตราส่วน กำไรต่อขาดทุน
cBot
ECN-friendly
Multi Pair Demo Day 15
12%
ROI
2.35
อัตราส่วน กำไรต่อขาดทุน
cBot
Forex
XAUUSD
"The Best Bot for XAUUSD Super Profits" is the updated version of an automated trading system specialized in Gold (XAUUS
13.9%
ROI
50
อัตราส่วน กำไรต่อขาดทุน
cBot
GBPUSD
NAS100
+4
Evolving financial strategy LIVE
1.07
อัตราส่วน กำไรต่อขาดทุน
cBot
Forex
XAUUSD
BEST PRO XAUUSD LIVE
136.2%
ROI
1.95
อัตราส่วน กำไรต่อขาดทุน
cBot
Forex
EURUSD
+1
Motive C Bot LIVE
2.18
อัตราส่วน กำไรต่อขาดทุน
cBot
Forex
BTCUSD
+2
ALGOS ONE BOT CRYPTO
4
อัตราส่วน กำไรต่อขาดทุน
cBot
Forex
EURUSD
+3
MULTI-PAIR c BOT GOLD SWITCH MODE v4.1
36.6%
ROI
1.38
อัตราส่วน กำไรต่อขาดทุน
อินดิเคเตอร์
ATR
EMA
+4
MULTI FIBO COMPSS PRO
cBot
BTCUSD
XAUUSD
OPTI GOLD-BTC Multi SCALPER
12.98
อัตราส่วน กำไรต่อขาดทุน
cBot
Grid Recovery
DMG GALAXY GOLD SCALPER PREMIUM ✨
30.26
อัตราส่วน กำไรต่อขาดทุน

นอกจากนี้คุณยังอาจชอบ

อินดิเคเตอร์
Prop
Forex
+12
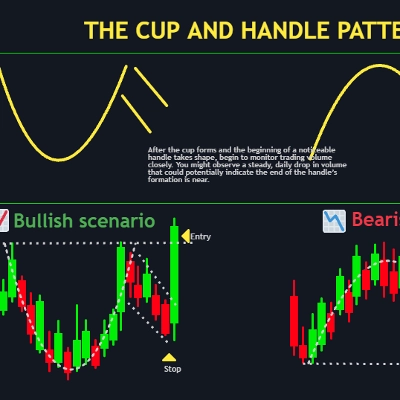
📊Identify and validate rounding price structures—commonly known as "Cups" and "Inverted Cups"—using...
อินดิเคเตอร์
Signal
USDJPY
See USD demand in one line—Composite OBV fuses six major FX pairs into a clear momentum gauge.
อินดิเคเตอร์
Imbalance
Key Levels
+5
Smart Money Concepts (SMC) indicator with real-time Fair Value Gap (FVG) boxes, $50 round numbers, and live market HUD.
"ATR Bands" โลโก้
ยอดนิยม
4.7
(4)
จาก $9
อินดิเคเตอร์
ATR
Prop
+13
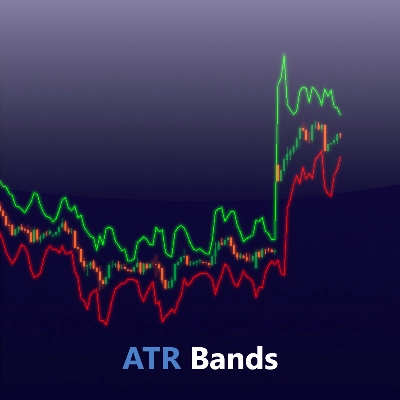
Enhance trading with ATR Bands! Visualize market volatility using dynamic upper and lower ATR bands for precise decision
"Dem" โลโก้
เรตติ้งสูง
4.2
(4)
$20
อินดิเคเตอร์
Forex
BTCUSD
+5
Scalping indicator for Renko 100 using EMAs to show trend and entry zones with clear colored rectangles.
อินดิเคเตอร์
ATR
EMA
+5
Candle timer with live profit tracking on chart – displays pips, currency value, and percentage in real time.
อินดิเคเตอร์
RSI
Signal
+1
Multi-timeframe version of the Quantitative Qualitative Estimation (QQE) indicator.
อินดิเคเตอร์
Prop
Forex
+5
Traders Panel: Scan 15 pairs across 5 timeframes. Live heatmap, strength rankings and best setups in one panel.
อินดิเคเตอร์
Market Structure
Support & Resistance
Auto-centers price when it moves beyond threshold. Adjustable zoom. Works on any chart type. Never lose price again.
"LT_SmartSwings" โลโก้
ยอดนิยม
5.0
(2)
$19
/
$25
อินดิเคเตอร์
ATR
Breakout
Detects swing highs/lows, structure, breakouts, trend lines, and fibs — great for price action trading.
"Axiom Matrix" โลโก้
ใหม่
4.6
(3)
$39
อินดิเคเตอร์
Volume
Support & Resistance
Compare up to 27 symbols across eight timeframes with seven analysis engines and an interactive cTrader dashboard.
อินดิเคเตอร์
Auto Fibonacci Retracement Indicator.
อินดิเคเตอร์
Moving Average
An Indicator made for scalping. Shows you the Sniper movement on Chart with the colour signals.
"session indicator" โลโก้
ยอดนิยม
4.3
(3)
$20
อินดิเคเตอร์
SMC
Prop
+4
📈 Trading Sessions Indicator — London, New York & Tokyo Visualize Key Market Sessions + High/Low Levels with Precision
อินดิเคเตอร์
ADX
ATR
+5
Precision Sniper by PrimeQuant: Advanced confluence engine with auto-presets, dynamic TP/SL, and live backtest stats.
อินดิเคเตอร์
Moving Average
Multi Time Frame Moving Average is a powerful and flexible indicator for cTrader
อินดิเคเตอร์
RSI
Breakout
+1
🔍 Automatically detect support and resistance levels based on "swings" or pivots
อินดิเคเตอร์
Prop
Scalping
Shows bars from different Time Frame on zoom out and hides the current bars. Perfect tool for Multi TF "Market Reply"

ราคา

12
การขาย
1.64K
ติดตั้งฟรี