

Opis
MTC INTERACTIV RAINBOW PRO
DLACZEGO TEN RAINBOW JEST INNY
Wskaźniki Rainbow istnieją od lat, to piękne pasma średnich kroczących na wykresie. Problem: prawie nikt tak naprawdę nie wie, jak je czytać ani jak przekształcić je w decyzje. Wyglądają świetnie… a potem pozostają nieużywane.
MTC Interactiv Rainbow Pro rozwiązuje dokładnie ten problem, interaktywnie. Zamiast wpatrywać się w dziesiątki kolorowych linii i zgadywać, pracujesz Z tęczą: najeżdżasz, klikasz, skupiasz się, mierzysz i pozwalasz wykresowi wyjaśnić się samemu.
CO WIDZISZ
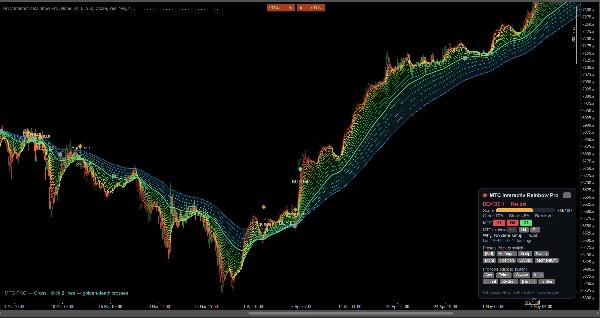
• Gęstą, płynną tęczę EMA, która pokazuje kierunek trendu, siłę i momentum na pierwszy rzut oka.
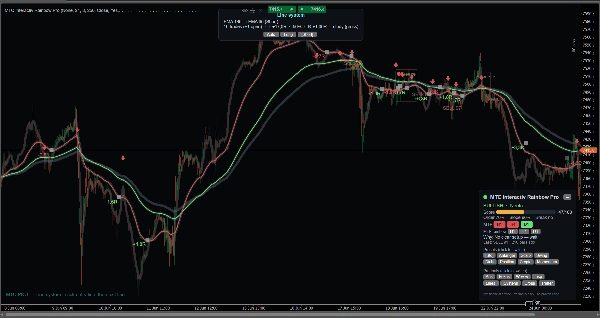
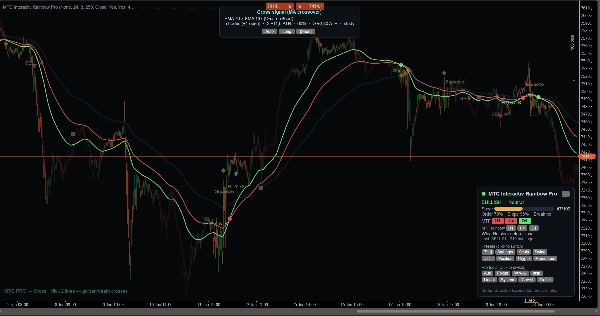
• Wyraźne znaczniki KUP / SPRZEDAJ / WYJŚCIE oraz strefy ściskania/przebicia — wszystko na zamkniętych słupkach, bez przemalowywania.
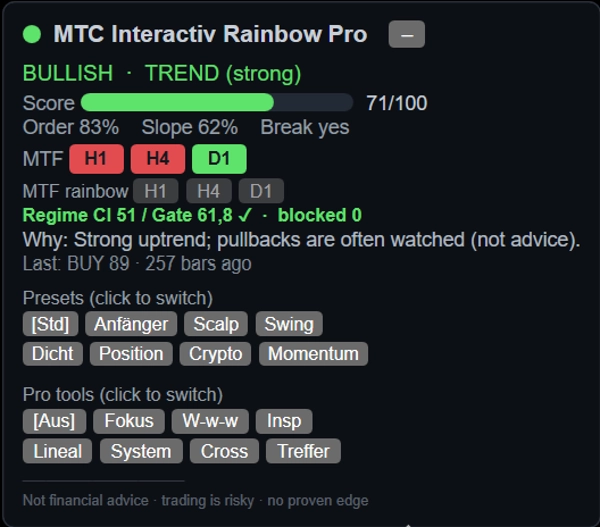
• Kompaktowy, na żywo panel kontrolny: kierunek, wynik siły 0–100, odczyty zamówień/spadków/przebić, konsensus wielookresowy i prosty język „dlaczego”.
CO SPRAWIA, ŻE JEST INTERAKTYWNY (część, której nikt inny nie daje)
• Najedź na dowolną linię, aby natychmiast zobaczyć jej okres EMA — wreszcie wiesz, którą średnią oglądasz.
• Skup się na pojedynczej linii i przyciemnij resztę dla czystego widoku.
• Narzędzia „co jeśli” i Inspekcja do badania dowolnego słupka lub przeszłego sygnału.
• Wbudowana linijka (ATR / R / pipsy).
• Badania Systemu Linii i Krzyżowania, aby zbadać, jak dwie średnie się ze sobą łączą.
• Badanie wskaźnika respektowania: jak często cena faktycznie respektuje wybraną linię.
• Nakładka MTF Rainbow jednym kliknięciem: zobacz tęczę H1 / H4 / D1 na swoim aktualnym wykresie w szarości.
• 8 gotowych presetów jednym kliknięciem (Początkujący, Scalping, Swing, Pozycja, Crypto, Momentum, Gęsty, Standard).
• Opcjonalny filtr reżimu i nakładka zarządzania transakcjami (stop strukturalny, pasmo ryzyka 1R, linia podążająca) dla zdyscyplinowanego myślenia o ryzyku.
JAK TO CZYTAĆ
Rozłożone i uporządkowane = silny trend. Ściskające się razem = zwijanie, przebicie jest blisko. Strzałka w górę/w dół = sygnał przebicia. Im gęstsze i bardziej uporządkowane pasmo, tym silniejszy ruch. Wbudowany interaktywny samouczek (angielski i niemiecki) przeprowadza cię przez to krok po kroku.
DLA KOGO TO JEST
• Początkujący, którzy zawsze chcieli używać tęczy, ale nigdy nie wiedzieli jak — interaktywne narzędzia uczą cię w trakcie pracy.
• Doświadczeni traderzy, którzy chcą szybkiego, czystego odczytu trendu, momentum i kontekstu wielookresowego.
• Twórcy botów: przejrzysta baza badawcza dla własnych strategii i botów EMA / MA.
Działa na dowolnym symbolu i interwale; narzędzia interaktywne błyszczą na M5–H4. Brak minimalnego rozmiaru konta — to narzędzie analityczne, nie autotrader.
WAŻNE — PROSZĘ PRZECZYTAJ
To jest narzędzie do analizy i nauki, NIE porada inwestycyjna i nie gwarancja zysku. Wszystkie sygnały, wyniki i symulowane transakcje to obserwacje, a nie statystycznie potwierdzona przewaga. Handel z dźwignią jest ryzykowny i może prowadzić do całkowitej utraty kapitału. Zawsze podejmuj własne decyzje i najpierw testuj na koncie demo.
Podsumowanie
Key features include an interactive interface allowing users to hover over lines to identify EMA periods, focus on individual lines, and use tools like "What-if" analysis, inspection of past signals, and a built-in ruler measuring ATR, price range, and pips. The indicator offers line-system and cross studies to analyze interactions between averages, a respect-rate study to assess price adherence to specific lines, and a one-click multi-timeframe rainbow overlay showing higher timeframe EMAs in grey.
A compact live dashboard provides a 0–100 strength score, order, slope, breakout readings, multi-timeframe consensus, and plain-language explanations. Eight one-click presets cater to various trading styles and markets, including scalp, swing, position, crypto, and momentum trading. Additional features include an optional regime filter and trade-management overlays for risk control.
Suitable for all symbols and timeframes, especially effective on M5 to H4 charts, this tool supports traders ranging from beginners learning to use EMA rainbows to experienced traders and bot developers seeking a transparent EMA research base.




















