present
Зарегистрируйтесь и получите скидку $50 на первую покупку
Trading product for Pivot Levels Индикатор Fibonacci Fair Value Gap, image 1
Pivot Levels
Индикатор
Версия 1.1, Nov 2026
Windows, Mac
Trading product for Pivot Levels Индикатор Fibonacci Fair Value Gap, image 2
1
Бесплатные установки

Описание

Pivot Levels: sessions, previous day and week, ORB, Floor Pivot and Camarilla

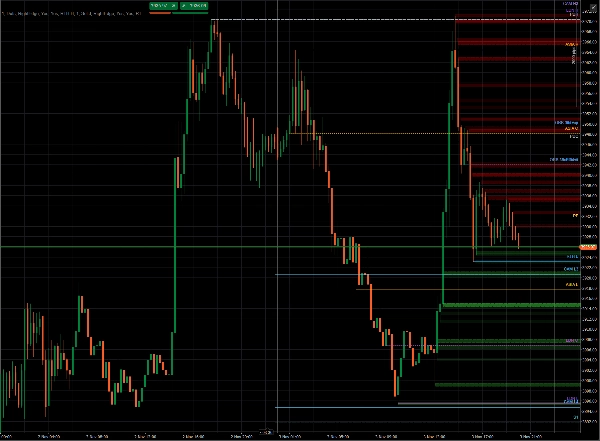
Pivot Levels puts the price levels that traders watch every day on your chart, drawn as clean rays with labels, and adds a compact table with the range of each session. It is a display-only study: it places no orders and changes nothing on your account.

What it draws

  • Today's sessions: Open, High and Low of the RTH session (09:30–16:00 New York), the Asian session (Tokyo) and the London session. Session times follow their own time zones, so daylight saving is handled for you, and you don't type any hours
  • Yesterday: Open, High, Low and Close of the previous trading day
  • Previous week: Open, High, Low and Close of the previous week.
  • Opening Range Breakout (ORB): the high ("up") and low ("down") reached in the first 15 and 30 minutes of the RTH session. Draw them only once the range has formed, or in real time while it forms
  • Floor Pivot: PP, R1, R2, S1, S2, calculated from the previous trading day
  • Camarilla: H3, H4, H5, L3, L4, L5, calculated from the previous trading day

Each line starts where its value was formed (the time of the high, the low or the open), so you can see when a level was set. Current levels extend to the right as rays. Past days can optionally be shown for review.


Session Range Monitor

A small table shows, for each session of the current trading day, its range in points and pips and an arrow for the direction of the session. The live session is highlighted. You choose the corner, the offsets and the font size.


Trading day without setup

By default the trading day is taken from your broker's own Daily bars, so rollover and daylight saving are the real ones for your server and nothing needs to be configured.

Alternatively you can use a fixed 17:00 New York day, identical across brokers. You can also compute yesterday, weekly and pivot levels on the full session or on RTH only.


Customization

  • Every level has its own switch, label, line width, line style, color (with the native color picker), label side and optional price value
  • Label position: left, right (follows the last bar), or anchored to the right or left edge of the chart, next to the Y axis, even while you scroll or zoom
  • A general switch to show labels only, or labels with values, and a label font size
  • History loads in the background, so the chart stays responsive. The data timeframe is chosen automatically from your chart and can be changed


Good to know

  • Works on any symbol and chart timeframe supported by your CFD broker's data since all levels are derived from price only
  • Levels are calculated from the data your broker provides, so values can differ slightly between brokers
  • This is an analysis tool, not trading advice. Past levels do not guarantee future price behavior


Сводка

Профиль индикатора
Категория индикатора
Поддержка и сопротивление
Тип вывода
Визуализация
Требования к данным
Только бары
Поддерживаемые сигналы
Прорыв
Разворот
Сила тренда
Волатильность
Касание уровня
Прорыв уровня
Диапазон открытия сессии
Расхождение
Пересечение

Обсуждение

Отзывы покупателей

0.0
Отзывы: 0
Отзывы покупателей
У этого продукта еще нет отзывов. Уже попробовали его? Поделитесь впечатлениями!

Частые вопросы

Fibonacci
Fair Value Gap
Key Levels
Order Block
Market Structure
Supply & Demand
Support & Resistance
Продукты, доступные в cTrader Store, включая торговых ботов, индикаторы и плагины, предоставляются сторонними разработчиками и доступны исключительно в информационных и технических целях. cTrader Store не является брокером и не предоставляет инвестиционные консультации, персональные рекомендации или какие-либо гарантии будущей доходности.

Больше от этого автора

Индикатор
Fibonacci
Key Levels
+5
Displays the swing level zones shared by Flex Renko Inverse on any timeframe chart. Requires Flex Renko Inverse
Логотип продукта "Flex Renko Inverse"
Высокий рейтинг
4.2
(4)
$99
Индикатор
Pin Bar
Order Block
+5
NEVER MISS A TREND & LET TRENDS RUN with Sierra Chart's Flex Renko Inverse, rebuilt for cTrader.

Вам также может понравиться

Логотип продукта "Multi VWAP"
Новинка
4.6
(3)
от $9
Индикатор
VWAP
Volume
+5
Multi VWAP. Three timeframes. One clean chart. Your Essential Trading Tool.
Индикатор
AI
SMC
+7
The ultimate tool for Price Action and ICT. High, Low and Mid levels for days, weeks Inc. NY Midnight and Custom Range.
Индикатор
Shows daily and sessions highs / lows and session boxes, everything configurable
Индикатор
Volume
Key Levels
View tick activity across a selected chart range with Point of Control, Value Area High and Value Area Low.
Логотип продукта "vwap"
Хит
4.8
(5)
$26
Индикатор
VWAP
Forex
+2
Custom VWAP Indicator for cTrader
Индикатор
Imbalance
Fair Value Gap
+1
Multi-symbol, multi-timeframe Fair Value Gaps in one panel.
Индикатор
Auto-detect supply & demand zones, remove broken levels, and trade smarter with real-time alerts. Precision made simple.
Логотип продукта "AutoLines™ Support & Resistance"
Высокий рейтинг
4.6
(5)
$19
/
$20
Индикатор
Breakout
FlexSR auto‑detects pivot highs/lows to plot dynamic support & resistance lines Features customizable styling and option
Индикатор
RSI
Fibonacci
+1
Spot RSI divergences on your chart and get an entry, stop and six targets when your filters line up.
Логотип продукта "ICT Killzones & Macros"
Высокий рейтинг
4.7
(4)
$20
/
$30
Индикатор
SMC
Prop
+8
KILLZONES AND MACRO SESSIONS
Индикатор
ATR
Volume
+3
Volume profile key levels - POC, value area, volume peaks and troughs - with break, rejection and retest signals
Индикатор
Customize your Moving Average! Choose any timeframe and price source for precision and flexibility in your analysis.
Логотип продукта "THIS BURNS JP225 INDICATOR"
Высокий рейтинг
4.5
(6)
$25
/
$30
Индикатор
AI
Signal
+1
🔥 THIS BURNS JP225 INDICATOR – Professional Trading Signals
Индикатор
Prop
Forex
+4
Fractals is a precision-engineered trading indicator for cTrader that reveals the hidden architecture of price action.
Индикатор
SMC
Prop
+14
an all-in-one Smart Money Concepts (SMC) toolkit featuring Premium/Discount zones.
Индикатор
Moving Average
An Indicator made for scalping. Shows you the Sniper movement on Chart with the colour signals.
Индикатор
Conquer the markets with MA Sabres! This indicator spots trend flips with MAs and cool Sabre shapes & alerts.
Индикатор
BOS
EMA
+5
Market structure signals graded A to C, each with a drawn trade plan, plus an adaptive trend ribbon and a trend matrix

Цена

1
Бесплатные установки