present
Registrieren Sie sich und erhalten Sie $50 Rabatt auf Ihren ersten Kauf
Trading product for Dynamic swing levels reader Indikator Fibonacci Fair Value Gap, image 1
Dynamic swing levels reader
Indikator
1 downloads
Version 1.1, Nov 2026
Windows, Mac
Trading product for Dynamic swing levels reader Indikator Fibonacci Fair Value Gap, image 2
1
Kostenlose Installationen

Beschreibung

Dynamic Swing Levels Reader - the companion to Flex Renko Inverse

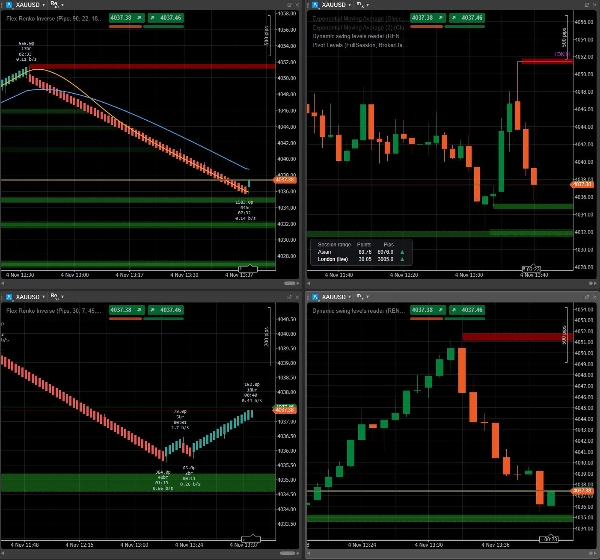
Flex Renko charts are excellent for spotting where the market really turned. Most traders, though, still execute on regular timeframe charts: M1, M5, H1. Dynamic Swing Levels Reader connects the two. It takes the swing zones from a Flex Renko Inverse chart and draws them, live, on any timeframe chart of the same symbol.


What "Requires Flex Renko Inverse" means

This indicator does not calculate anything by itself. It is a reader. The zones are created by Flex Renko Inverse, our main study, which builds renko bricks tick by tick and marks every confirmed reversal as a swing zone. Zones that price has not yet come back to are shared, and the Reader displays exactly those.

Without Flex Renko Inverse running on one of your charts, the Reader has nothing to show. That is why it is free: it extends the main study, it does not replace it.


How it works

  1. Open a Flex Renko Inverse chart and give it a name in "Instance name" (for example RENKO_CONTEXT)
  2. On any timeframe chart of the same symbol, add Dynamic Swing Levels Reader and type the same name in "Read swing levels from"
  3. That's it. The zones appear and stay in sync. When price reaches a zone it disappears from both charts, and new zones show up as soon as the renko chart creates them

Both charts must be open in cTrader on the same computer. If something is not connected (wrong name, different symbol, renko chart closed), the indicator tells you on the chart what is missing.


Why get Flex Renko Inverse

The swing zones are just one of its features. Flex Renko Inverse gives you:

  • Renko bricks built from real ticks, never from aggregated bars, with separate settings for trend continuation and reversal. Closed bricks never repaint
  • Swing zones with strength: the bigger the move that started from a turning point, the more visible its zone
  • Leg labels with the size, number of bricks, duration and speed of every swing, plus an arrow when the current leg is moving faster than usual
  • A rotation dashboard that shows, across 1, 5, 15 and 30 minutes, whether swings are getting wider or narrower and which side is in control
  • Moving averages calculated on bricks, not on hidden candles
  • The real time of every brick under your cursor

Use a slower renko as your context, share its zones, and trade them on the timeframe you are used to.


👉 Get Flex Renko Inverse: https://ctrader.com/products/5546

Zusammenfassung

KI-Zusammenfassung
Dynamic Swing Levels Reader is an indicator designed to display swing level zones generated by the Flex Renko Inverse study on any timeframe chart within cTrader. It functions as a companion tool that reads and visualizes swing zones created by Flex Renko Inverse, which builds Renko bricks tick-by-tick and identifies confirmed reversals as swing zones. These zones are shared live and synchronized between the Flex Renko Inverse chart and any other chart of the same symbol, allowing traders to view Renko-based swing levels on their preferred timeframe charts (e.g., M1, M5, H1).

To use it, a Flex Renko Inverse chart must be open and named; the Dynamic Swing Levels Reader then references this name to display the corresponding swing zones. Zones disappear once price revisits them, and new zones appear as the Renko chart updates. Both charts must be open simultaneously on the same computer.

Flex Renko Inverse offers advanced features including real-tick Renko bricks with separate trend and reversal settings, swing zones weighted by move strength, detailed leg metrics (size, duration, speed), a multi-timeframe rotation dashboard, and moving averages calculated on bricks. This setup enables traders to use slower Renko charts for market context while executing trades on their usual timeframe charts.

Indikatorprofil
Indikatorkategorie
Unterstützung und Widerstand
Ausgabetyp
Visualisierung
Datenanforderungen
Nur Balken
Externe Daten
Unterstützte Signale
Durchbrechen
Abweichung
Ausbruch
Wendepunkt
Trendstärke
Volatilität
Level – Berührung
Level – Durchbrechen

Diskussion

Kundenbewertungen

0.0
Bewertungen: 0
Kundenbewertungen
Bisher gibt es keine Bewertungen für dieses Produkt. Haben Sie es schon ausprobiert? Dann können Sie die erste Person sein, die andere darüber informiert!

Häufig gestellte Fragen (FAQ)

Fibonacci
Fair Value Gap
Key Levels
Order Block
Market Structure
Supply & Demand
Support & Resistance
Über den cTrader Store verfügbare Produkte, einschließlich Handelsbots, Indikatoren und Plugins, werden von externen Entwicklern bereitgestellt und nur zu Informations- und technischen Zugriffszwecken verfügbar gemacht. cTrader Store ist kein Broker und erbringt keine Anlageberatung, persönlichen Empfehlungen oder eine Garantie für zukünftige Performance.

Mehr von diesem Autor

Indikator
Pin Bar
Order Block
+5
NEVER MISS A TREND & LET TRENDS RUN with Sierra Chart's Flex Renko Inverse, rebuilt for cTrader.
Indikator
Fibonacci
Key Levels
+5
Draws RTH, Asian, London, prior day/week, ORB, Floor and Camarilla pivot levels as rays, with a session range table.

Das könnte Sie auch noch interessieren

Indikator
SMC
Prop
+15
Automatic Elliott Wave Detection with Professional Filters
Indikator
BOS
MSS
+3
Advanced indicator to highlight key execution context and help aligning structure, location, and risk.
Indikator
Volume
Order Block
+3
Map market structure, order blocks, liquidity and key zones with an interactive cTrader dashboard.
Indikator
Drawdown Monitor
Protect your funded account. Real-time Daily Equity Drawdown monitor with Green / Orange / Red flashing alerts.
Indikator
Prop
Forex
+11
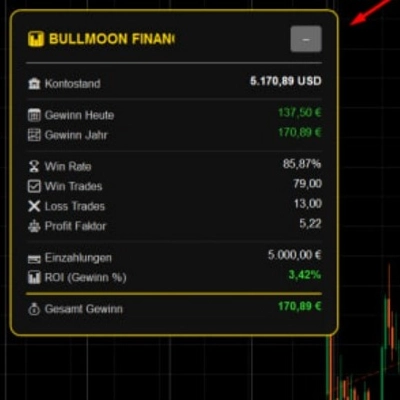
Performance Panel von BullMoon Finance: Analysiere Deine cTrader-Historie visuell direkt im Chart!
Indikator
Breakout
FlexSR auto‑detects pivot highs/lows to plot dynamic support & resistance lines Features customizable styling and option
Indikator
ATR
Key Levels
+1
Explore 88 harmonic price-pattern variants with interactive chart controls and geometric reference levels.
Indikator
ATR
RSI
+5
Binary Options Signals Pro – Precision Trading at Your Fingertips
Indikator
ATR
Prop
+7
Smart momentum tool uses advanced filtering and colour cues for clearer market direction and trading signals.
Indikator
Forex
BTCUSD
+11
Next-gen Volume Oscillator using Hyperbolic Tangent math. No repainting. Includes arrows, alerts, and overlay mode 🎯
Indikator
Volume
Key Levels
Interactive tick-volume profile with a draggable range box, sculpted histogram, and POC, VAH and VAL levels.
Indikator
One‑click RSI robot for consistent rapid‑fire trades.
Indikator
ATR
EMA
+3
The UTBot you know from TradingView — now on cTrader with confirmed signals, VWAP, EMA and session overlays.
Indikator
Imbalance
Key Levels
+1
Keep open imbalance zones, untouched session highs and lows and the day's ADR range in view, without scrolling back.
Indikator
Signal
Scalping
Enhance Your Trading Strategy with the Larry Williams 9-5-3 Indicator
Indikator
SMC
VWAP
+5
Most advanced Volume Profile Pivot Box indicator — auto pivots, volume zones, smart candle coloring & SMC trading tool.
Indikator
Forex
Crypto
+2
Market Structure Indicator – Your Trading Map in a Noisy Market. No more Panicking Which one, Where, Why and How.

Preis

1
Kostenlose Installationen