present
Sign up and get $50 off your first purchase
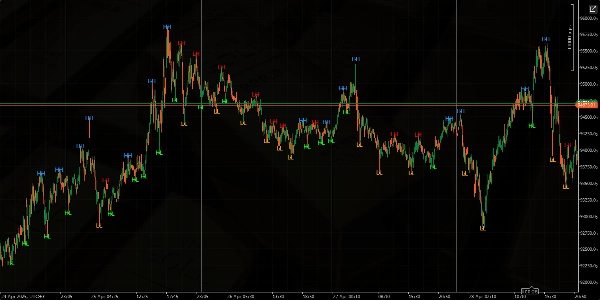
Trading product for Higher Highs Lower Lows Indicator, image 1
Higher Highs Lower Lows
Indicator
47 downloads
Version 1.0, Apr 2025
Windows, Mac
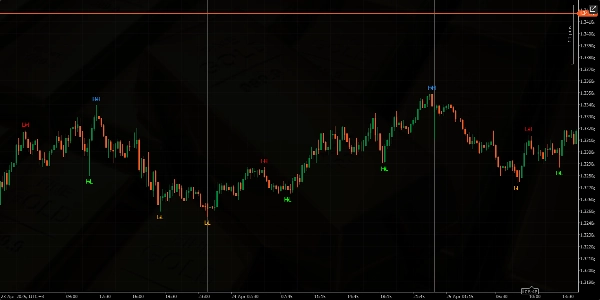
Trading product for Higher Highs Lower Lows Indicator, image 2
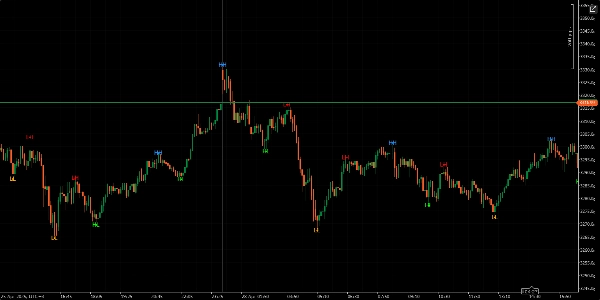
Trading product for Higher Highs Lower Lows Indicator, image 3
Trading product for Higher Highs Lower Lows Indicator, image 4
Trading product for Higher Highs Lower Lows Indicator, image 5
Since 16/03/2025
256
Free installs

Description

Summary

AI summary
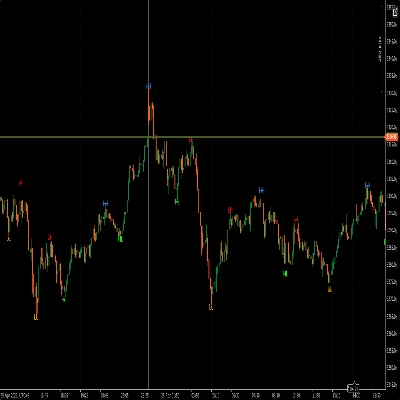
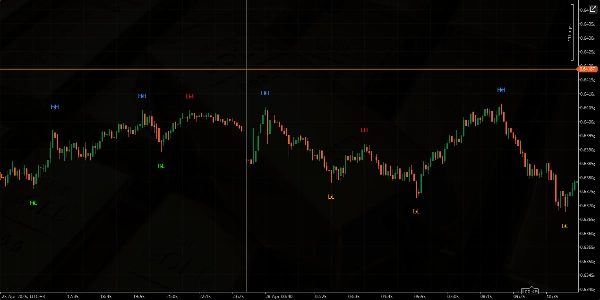
Higher Highs Lower Lows is a technical indicator designed to automatically detect and mark key market structure points on trading charts. It identifies and highlights higher highs, lower highs, higher lows, and lower lows, which are fundamental elements in analyzing price trends and market momentum. This indicator assists traders by visually marking these critical price levels, facilitating the assessment of market direction and potential trend reversals. It can be applied across various markets and timeframes to support technical analysis. Installation of the indicator enables automatic market structure recognition without manual plotting.
Indicator profile

Customer reviews

0.0
Reviews: 0
Customer reviews
No reviews for this product yet. Already tried it? Be the first to tell others!

Discussion

FAQ

Products available through cTrader Store, including trading bots, indicators and plugins, are provided by third-party developers and made available for informational and technical access purposes only. cTrader Store is not a broker and does not provide investment advice, personal recommendations or any guarantee of future performance.

More from this author
Indicator
ATR
RSI
+8
The WaveTrend Indicator is a multifunctional oscillator designed to center the trend wave or movements in the trend.

You may also like

Indicator
Breakout
FlexSR auto‑detects pivot highs/lows to plot dynamic support & resistance lines Features customizable styling and option
Indicator
SMC
Prop
+5
Automatically draws the Opening Range (High & Low) for Tokyo, London, and New York sessions. Configurable start times,
Indicator
Doji
Volume
+5
Instantly spot high-liquidity institutional moves with clean, non-obtrusive triangle alerts on cTrader charts.
Indicator
MSS
Volume
+3
Rejection-based volume profile with tiered heat zones, POC levels and a fully draggable anchor on cTrader.
Indicator
AI
ATR
+23
The ZigZag Trend is a market structure tool that filters out small price fluctuations and highlights major swing.
Indicator
SMC
Forex
+5
Detect institutional breakout zones with smart volume & channel analysis — by PrimeQuant.
Indicator
EMA
Volume
+4
Advanced volume‑profile tool with delta, HVN/LVN zones, and precise POC‑based trade signals.
Indicator
AI
BOS
+4
Golden Boom and Crash Spike Detector is a trading tool designed for Crash 300 and Boom 300 indices on M1 Timeframe.
Indicator
ADX
ATR
+5
Signal Quality Score - 0-100 filter combining RSI, Volume, ATR, Trend Strength & Alignment. Works on ANY chart type.
Indicator
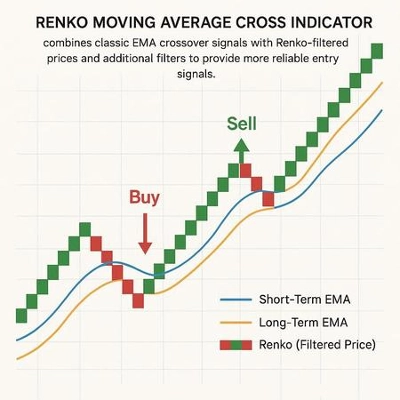
The Renko Moving Average Cross indicator combines classic EMA crossover signals with Renko-filtered prices.
Indicator
SMC
Prop
+16
📊 VWAP with MTF & Dynamic Deviation Bands
Indicator
AI
Forex
+3
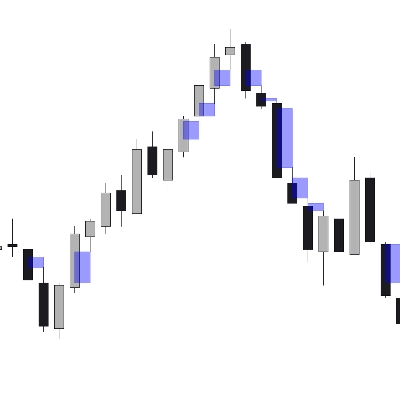
Smart Money FVG & Imbalance Detector – Precision Institutional Tool
Indicator
Universal Moving Average indicator with extended features
Indicator
Order Block
Fair Value Gap
+1
This indicator contains most of the ICT strategies that you need. You can turn on/off each one to be shown.
Indicator
AI-assisted
Tired of staring at the same old charts? The Theme Customizer indicator brings a whole new level of personalization
Indicator
ATR
RSI
+1
Super Trend Rsi ,ATR + trend change distance + dynamic Alpha, divergence/convergence
Indicator
AI
ATR
+27
Market Cipher B
Indicator
PVA Volume Analysis Indicator:Price volume over trend strength and direction

Price

Since 16/03/2025
256
Free installs