
WAVETREND_withSourceCode
อินดิเคเตอร์
เวอร์ชัน 1.0, Oct 2025
Windows, Mac
5.0
รีวิว: 2
คำอธิบาย
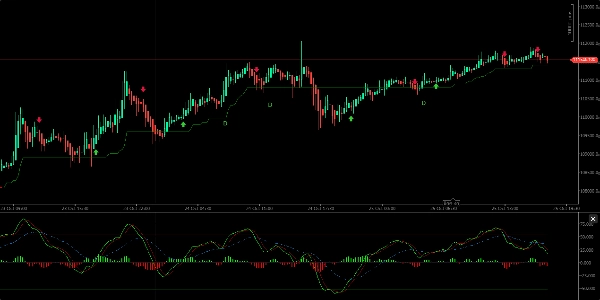
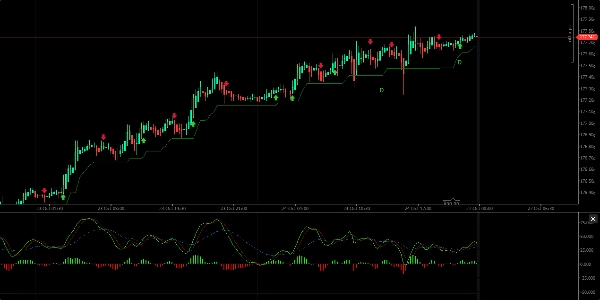
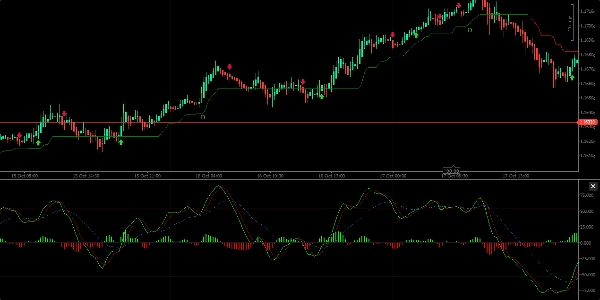
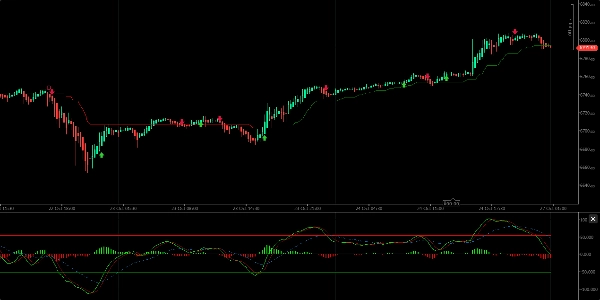
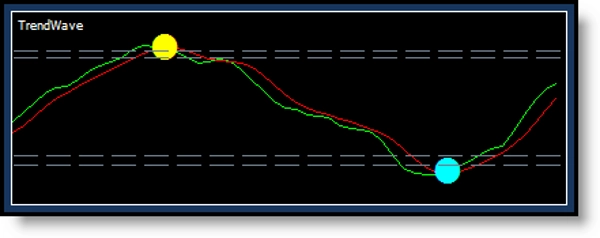
มันให้สัญญาณซื้อ-ขาย, การบ่งชี้ทิศทางแนวโน้ม และระบุโซนที่ซื้อมากเกินไปและขายมากเกินไป ทางสายตา ประกอบด้วยเส้นค่าสองเส้นพร้อมกับเมฆ/ฮิสโตแกรมตรงกลาง ซึ่งเคลื่อนที่เหนือและใต้เส้นกลาง แสดงถึงแนวโน้มที่เพิ่มขึ้นหรือลดลง
คุณสมบัติหลัก:
- สัญญาณซื้อเกิดขึ้นเมื่อเส้นสีเขียวตัดเส้นสีแดงขึ้นด้านบน; สัญญาณขายเมื่อเส้นสีเขียวตัดลงด้านล่าง
- แสดงทิศทางแนวโน้มด้วยคลื่นเมฆเหนือหรือต่ำกว่าเส้นกลาง
- ตัวชี้วัดแสดงจุดสีเขียว (ซื้อ) และสีแดง (ขาย) บนจุดตัด พร้อมกับการเปลี่ยนสีแท่งเทียนที่สอดคล้องกัน (สีเหลืองสำหรับซื้อ, สีฟ้าครามสำหรับขาย)
- เหมาะสำหรับใช้ในช่วงเวลา 12 ชั่วโมงหรือ 1 วันเพื่อหลีกเลี่ยงเสียงรบกวนระยะสั้นที่มากเกินไป
- ตัวชี้วัดสามารถระบุความแตกต่างระหว่างราคาและโมเมนตัม (ความแตกต่างปกติของกระทิงและหมี) ซึ่งบ่งชี้ถึงการกลับตัวของราคาได้
- แนะนำให้รวม WaveTrend กับตัวชี้วัดอื่นๆ เช่น WMA, CMF, RSI และ MACD เพื่อการตัดสินใจซื้อขายที่น่าเชื่อถือมากขึ้น
โดยรวมแล้ว WaveTrend เป็นเครื่องมือที่ใช้งานได้ดีสำหรับการระบุทิศทางแนวโน้มและสัญญาณการซื้อขาย แต่ควรใช้ร่วมกับเครื่องมือวิเคราะห์อื่นๆ เพื่อยืนยันผล
สรุป
โปรไฟล์อินดิเคเตอร์
รีวิวจากลูกค้า
5.0
รีวิว: 2
5 | 100 % | |
4 | 0 % | |
3 | 0 % | |
2 | 0 % | |
1 | 0 % |
รีวิวจากลูกค้า
November 6, 2025
the main upside is the trade idea gets slowed down first. The setup still needs say no.
การสนทนา
คำถามที่พบบ่อย
Signal
ZigZag
EURUSD
Supertrend
GBPUSD
RSI
XAUUSD
NAS100
ATR
MACD
ผลิตภัณฑ์ที่มีให้บริการผ่าน cTrader Store รวมถึงบอทการเทรด อินดิเคเตอร์ และปลั๊กอิน มีให้บริการโดยนักพัฒนาบุคคลที่สามและมีไว้เพื่อวัตถุประสงค์ในการเข้าถึงข้อมูลและทางเทคนิคเท่านั้น cTrader Store ไม่ใช่โบรกเกอร์และไม่ได้ให้คำแนะนำการลงทุน คำแนะนำส่วนบุคคล หรือการรับประกันผลการดำเนินงานในอนาคต


ราคา
ตั้งแต่ 16/03/2025
256
ติดตั้งฟรี