
Descripción
🔷 Motor Premium de Líneas de Tendencia
Indicador de Estructura de Mercado Multicapa y Regresión Dinámica
https://chartshots.spotware.com/c/69d3c949a2e08
📌 ¿Qué es?
Motor Premium de Líneas de Tendencia es un indicador superpuesto que combina 5 módulos independientes en una sola herramienta. Cada módulo puede activarse o desactivarse. Mapea la estructura del mercado, canales dinámicos y zonas de regresión basadas en volumen directamente en el gráfico de precios.
Responde tres preguntas clave:
- ¿Dónde está el precio dentro de la estructura actual?
- ¿Cuál es la tendencia dominante y dónde están los puntos de ruptura?
- ¿En qué niveles de precio se concentra la actividad?
🧩 Los 5 Módulos
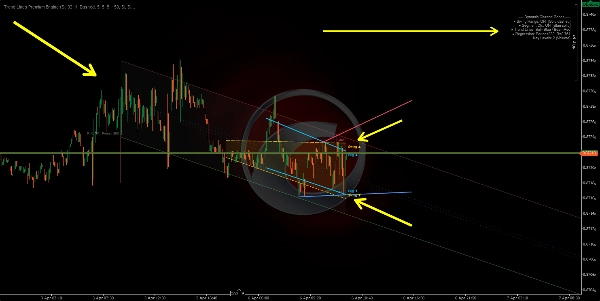
1️⃣ Conector de Rango de Swing
https://chartshots.spotware.com/c/69d3cab9b805b
Detecta los máximos y mínimos de swing más recientes, luego dibuja un canal inclinado que conecta el más antiguo con el más nuevo en ambos lados. El área entre ellos se rellena como una zona de rango dinámico.
Cómo funciona:
- Una barra califica como punto de swing cuando su máximo (o mínimo) es el más extremo comparado con N barras antes y N barras después.
- Se dibuja una línea recta desde el swing almacenado más antiguo hasta el más reciente, creando límites superior e inferior.
- El canal se desplaza automáticamente cada vez que se confirma un nuevo punto de swing.
Cómo leerlo:
- Precio dentro del canal → rango estructural definido.
- Ruptura por encima/debajo → expansión de volatilidad o cambio de estructura.
- Inclinación del canal → dirección predominante del rango.
Parámetro
Propósito
Barras Antes / Después del Swing
Barras requeridas a cada lado para confirmar un swing. Más alto = swings más significativos
Máximo de Puntos de Swing
Cuántos swings almacenar. Controla la profundidad del canal
Ventana de Historial
Qué tan atrás se dibuja el canal
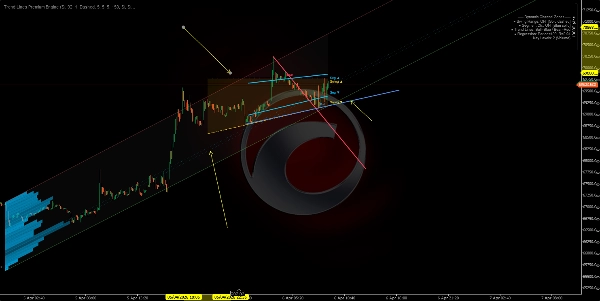
2️⃣ Canal Lineal Segmentado
https://chartshots.spotware.com/c/69d3cb221bba1
Divide la ventana de análisis en 5 segmentos iguales, encuentra el máximo más alto y el mínimo más bajo en cada uno, luego ajusta una línea de regresión de mínimos cuadrados a través de esos 5 puntos superiores y otra a través de los 5 puntos inferiores.
Cómo funciona:
- La ventana se divide en 5 partes. Se extrae un extremo representativo por parte.
- Se aplica regresión lineal sobre esos 5 puntos para cada límite.
- El resultado es un canal que se adapta a la estructura de precio segmentada en lugar de solo dos puntos finales.
Cómo leerlo:
- Canal ascendente → tendencia estructural alcista.
- Canal descendente → tendencia estructural bajista.
- Toques repetidos en un límite → soporte/resistencia dinámica.
Diferencia con el Módulo 1: Swing Range conecta solo el primer y último swing. Segment Channel usa regresión de 5 puntos, haciéndolo más suave y menos reactivo a un solo swing.
3️⃣ Etiquetas de Puntos de Swing
Detecta máximos y mínimos de swing y los clasifica en 4 categorías de estructura de mercado:
Etiqueta
Significado
Indica
HL
Mínimo más alto
Estructura alcista
HH
Máximo más alto
Estructura alcista
LH
Máximo más bajo
Estructura bajista
LL
Mínimo más bajo
Estructura bajista
Cómo funciona:
- Cada nuevo mínimo de swing se compara con el mínimo de swing anterior. Más alto → HL. Más bajo → LL.
- Cada nuevo máximo de swing se compara con el máximo de swing anterior. Más alto → HH. Más bajo → LH.
Cómo leerlo:
- Secuencia HL + HH → tendencia alcista intacta.
- Secuencia LH + LL → tendencia bajista intacta.
- Un HL que rompe a LL, o un LH que rompe a HH → cambio de estructura (BOS/CHoCH).
Por defecto solo se muestran HL y LH para mantener el gráfico limpio. HH y LL pueden habilitarse para visibilidad completa de la estructura.
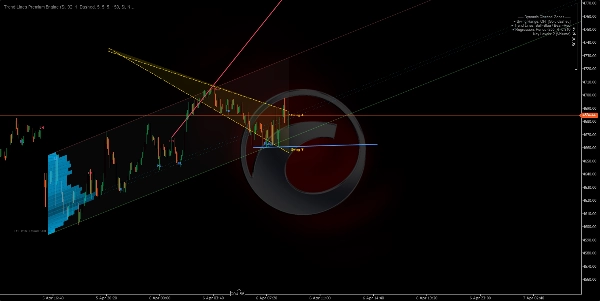
4️⃣ Líneas de Tendencia Automáticas
https://chartshots.spotware.com/c/69d3cc071272e
Dibuja líneas de tendencia conectando los dos mínimos de swing más recientes (línea alcista) y los dos máximos de swing más recientes (línea bajista). La línea activa es prominente; las líneas anteriores se desvanecen.
Cómo funciona:
- Nuevo mínimo de swing detectado → línea dibujada desde el mínimo de swing previo al nuevo (línea de tendencia alcista).
- Nuevo máximo de swing detectado → línea dibujada desde el máximo de swing previo al nuevo (línea de tendencia bajista).
- La línea se proyecta hacia adelante por un número configurable de barras.
- Cuando se crea una nueva línea, la anterior se desvanece a un color semitransparente.
Señales de ruptura (opcional): Cuando está habilitado, el indicador detecta si el precio de cierre cruza una línea de tendencia activa:
- 🔼 Flecha hacia arriba → ruptura alcista.
- 🔽 Flecha hacia abajo → ruptura bajista.
Parámetro
Propósito
Máximo de Pares de Líneas
Cuántos pares de líneas mantener visibles. Ajustar a 1 para la vista más limpia
Máximo de Barras de Extensión
Qué tan lejos se proyecta la línea hacia adelante. Evita que las líneas crucen todo el gráfico
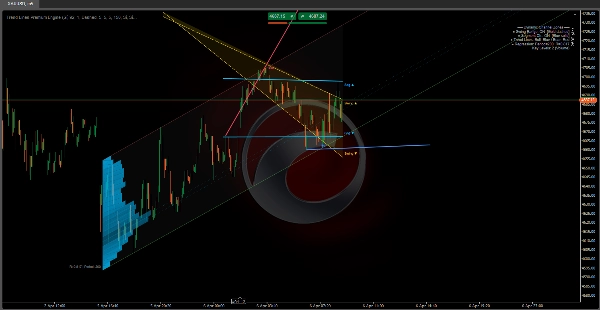
5️⃣ Zona de Regresión Dinámica
El módulo más avanzado. Calcula un canal de regresión lineal sobre los precios de cierre y superpone un perfil de actividad (histograma) que muestra dónde se concentró el volumen o los toques dentro del canal. También marca niveles clave en las zonas de mayor actividad.
A) Canal de Regresión:
- Se aplica regresión lineal de mínimos cuadrados a los precios de cierre durante un período dado.
- Se calcula la desviación estándar de los precios respecto a la línea de regresión.
- Se colocan bandas superior e inferior a N desviaciones estándar del centro (por defecto: 2.0).
- Opcionalmente se calcula en escala logarítmica para mayor precisión en instrumentos de precio alto o alta volatilidad.
B) Detección Automática de Período:
- El algoritmo prueba múltiples períodos (50 a 400 barras) y calcula el coeficiente de correlación de Pearson para cada uno.
- Selecciona el período con la correlación más alta — donde la regresión lineal mejor se ajusta al movimiento del precio.
- El valor de correlación se muestra en el gráfico (por ejemplo, R = 0.85).
C) Histograma de Actividad:
- El canal se divide en secciones horizontales (hasta 25).
- Para cada sección, el algoritmo cuenta cuántas barras tocaron ese nivel de precio, ponderado por volumen o número de toques (configurable).
- Las secciones de mayor actividad aparecen como barras más largas y opacas.
- Esto revela el Punto de Control (POC) y zonas de alta/baja actividad dentro del canal.
D) Niveles Clave:
- Las secciones con mayor actividad se proyectan hacia adelante como líneas horizontales.
- Funcionan como soporte y resistencia basados en volumen dentro del contexto de regresión.
Cómo leerlo:
- Precio cerca de la banda superior → zona estadísticamente sobrecomprada.
- Precio cerca de la banda inferior → zona estadísticamente sobrevendida.
- R cercano a 1 o -1 → tendencia lineal fuerte y confiable. R cercano a 0 → rango o regresión no significativa.
- Los niveles clave actúan como imanes de precio — las zonas con concentración histórica de actividad tienden a atraer el precio de vuelta.
🎯 Casos de Uso
Caso de Uso
Módulos
Identificar estructura de mercado (alcista/bajista/rango)
Etiquetas de Swing + Líneas de Tendencia
Detectar soporte y resistencia dinámicos
Rango de Swing + Canal Segmentado
Encontrar zonas de valor por volumen
Zona de Regresión + Niveles Clave
Confirmar rupturas de estructura
Líneas de Tendencia + Señales de Ruptura
Medir fuerza de la tendencia
Correlación de Pearson (Zona de Regresión)
⚙️ Configuración Recomendada por Estilo
Estilo
Módulos Sugeridos
Scalping (M1–M15)
Etiquetas de Swing + Líneas de Tendencia
Intradiario (M15–H1)
Todos los módulos
Swing Trading (H4–D1)
Rango de Swing + Zona de Regresión + Niveles Clave
Análisis puro de estructura
Solo Etiquetas de Swing + Líneas de Tendencia
⚠️ Notas Importantes
Resumen
The five modules include:
1. Swing Range Connector: Detects recent swing highs and lows to draw a sloped channel representing the structural range.
2. Segment Linear Channel: Divides the analysis window into five segments, fitting regression lines through highs and lows for a smoother channel.
3. Swing Point Labels: Classifies swing highs and lows into four market structure categories (Higher High, Higher Low, Lower High, Lower Low) to indicate bullish or bearish trends and structure shifts.
4. Automatic Trend Lines: Connects the two most recent swing highs and lows with trend lines, highlighting active lines and optionally signaling breakouts.
5. Dynamic Regression Zone: Calculates a linear regression channel on closing prices with an activity histogram showing volume or touch concentration, marking key volume-based support and resistance levels.
The indicator supports various trading styles, recommending specific module combinations for scalping, intraday, swing trading, and pure structure analysis. It requires price bars and volume data and provides visualizations and signals including breakout, trend strength, and level touches or breaks.


![Logotipo de "Smart Money Concepts (SMC) [Iridio Capital]"](https://cdn.ctrader.com/image/webp/28b69fd1-ef54-4bed-9487-07e78e883be4_40934)
