Descripción
Indicador de Máximos y Mínimos Principales: Una Visión General Completa
Introducción
En el mundo acelerado del trading, contar con las herramientas adecuadas a tu disposición puede marcar toda la diferencia. El indicador de Máximos y Mínimos Principales está diseñado para identificar puntos críticos de inflexión en el mercado, permitiendo a los traders tomar decisiones informadas. Esta poderosa herramienta utiliza algoritmos avanzados para localizar máximos y mínimos significativos, mejorando tu estrategia de trading y aumentando tu rendimiento general. Con una tasa de precisión promedio de alrededor del 60% al 70% en el marco temporal de 45 minutos, este indicador es un activo confiable para los traders que buscan capitalizar los movimientos del mercado, haciéndolo ideal tanto para traders diarios como para scalpers.
Características Clave
1. Representación Visual
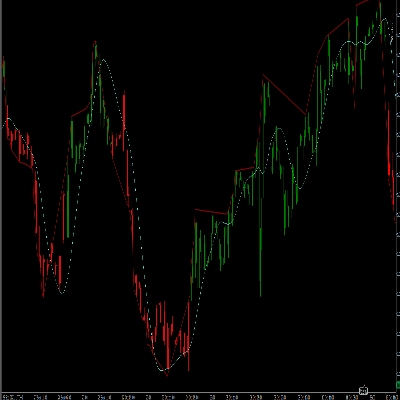
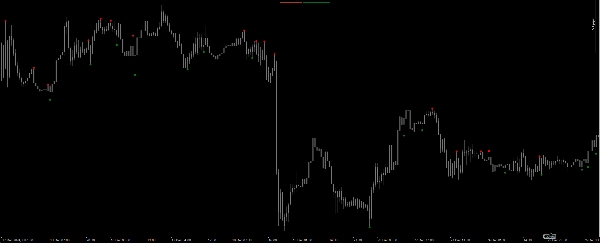
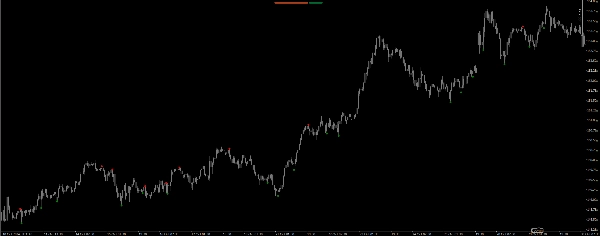
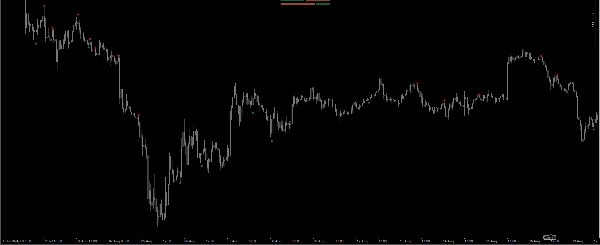
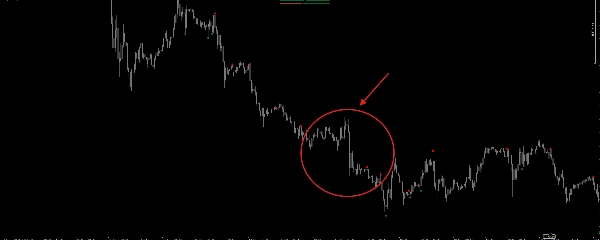
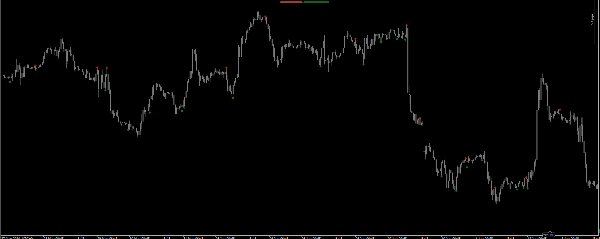
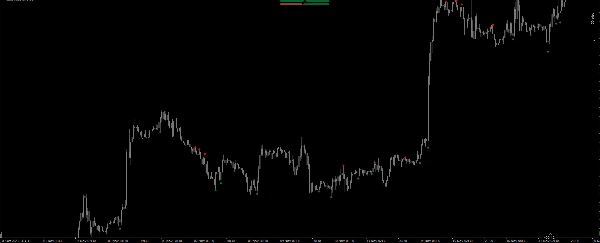
El indicador de Máximos y Mínimos Principales ofrece una representación visual clara de la dinámica del mercado. Con los máximos principales marcados en rojo y los mínimos principales en verde, los traders pueden identificar rápidamente posibles puntos de reversión. El uso de puntos asegura que estos niveles críticos destaquen en el gráfico, facilitando la detección de oportunidades de trading de un vistazo.
2. Cálculos Precisos
El núcleo del indicador de Máximos y Mínimos Principales reside en su método de cálculo. Al analizar la acción del precio de las últimas cuatro barras, el indicador determina si se ha formado un máximo o mínimo principal. Esto se logra mediante una serie de comparaciones de los precios máximos y mínimos, asegurando que solo se identifiquen puntos de inflexión significativos.
3. Técnicas Mejoradas de Scalping
Para los traders que se especializan en scalping, el indicador de Máximos y Mínimos Principales es un activo invaluable. Al identificar puntos clave de inflexión, los traders pueden entrar y salir de posiciones con precisión. La capacidad de detectar rápidamente máximos y mínimos principales permite establecer niveles ajustados de toma de ganancias (TP) y stop loss (SL), minimizando el riesgo mientras se maximizan las ganancias potenciales. Dada su precisión de alrededor del 60% al 70% en marcos temporales de 45 minutos, se recomienda encarecidamente usar stop losses para mitigar posibles pérdidas cuando se pierde una señal.
Beneficios de Usar el Indicador de Máximos y Mínimos Principales
1. Mejora en la Toma de Decisiones
El indicador de Máximos y Mínimos Principales capacita a los traders para tomar decisiones informadas basadas en un análisis preciso del mercado. Al identificar máximos y mínimos significativos, los traders pueden anticipar mejor los movimientos de precios y ajustar sus estrategias en consecuencia. Este proceso mejorado de toma de decisiones aumenta el rendimiento general del trading.
2. Mayor Potencial de Ganancias
Con la capacidad de localizar puntos críticos de inflexión, los traders pueden capitalizar las reversiónes del mercado de manera más efectiva. El indicador de Máximos y Mínimos Principales permite a los traders entrar en posiciones en momentos óptimos, aumentando su potencial de ganancias. Al utilizar niveles ajustados de TP y SL, los traders pueden maximizar sus ganancias mientras minimizan su exposición al riesgo.
3. Interfaz Fácil de Usar
El indicador de Máximos y Mínimos Principales está diseñado pensando en la experiencia del usuario. La representación visual clara de los máximos y mínimos principales asegura que los traders puedan interpretar fácilmente las señales proporcionadas por el indicador. Esta interfaz fácil de usar lo hace accesible para traders de todos los niveles de experiencia.
4. Aplicación Versátil
Ya seas un trader diario, swing trader o scalper, el indicador de Máximos y Mínimos Principales puede aplicarse en diversas estrategias de trading. Su versatilidad lo convierte en una adición valiosa al conjunto de herramientas de cualquier trader, permitiendo una mayor flexibilidad para adaptarse a diferentes condiciones del mercado.
Conclusión
En conclusión, el indicador de Máximos y Mínimos Principales es una herramienta poderosa que mejora las estrategias de trading al identificar puntos críticos de inflexión del mercado. Con sus cálculos precisos, representación visual y compatibilidad con la plataforma cTrader, este indicador capacita a los traders para tomar decisiones informadas y capitalizar los movimientos del mercado. Con una tasa de precisión de alrededor del 70%, es crucial implementar stop losses para minimizar pérdidas cuando se pierde una señal. Para obtener resultados óptimos, se recomienda usar este indicador en un marco temporal de 45 minutos. Ya seas un trader experimentado o estés comenzando, el indicador de Máximos y Mínimos Principales puede mejorar significativamente tu rendimiento en el trading. Eleva tu experiencia de trading hoy incorporando esta innovadora herramienta en tu estrategia.
Resumen
Valoraciones de clientes
5 | 50 % | |
4 | 50 % | |
3 | 0 % | |
2 | 0 % | |
1 | 0 % |