
Chandelier Exit
Индикатор
5 покупки
Версия 1.0, Oct 2025
Windows, Mac
4.3
Отзывы: 3
Описание
Представляем индикатор Chandelier Exit — ваш идеальный инструмент для оптимизации выхода из сделок с точностью и уверенностью.
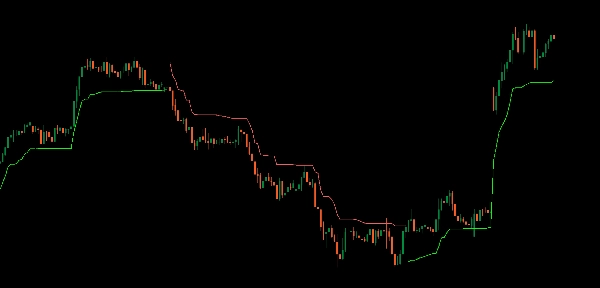
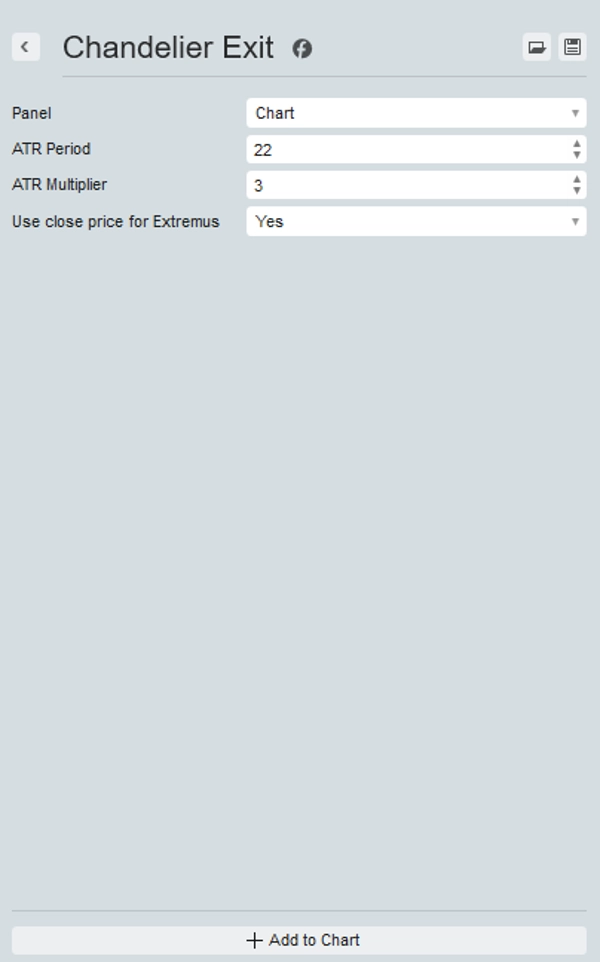
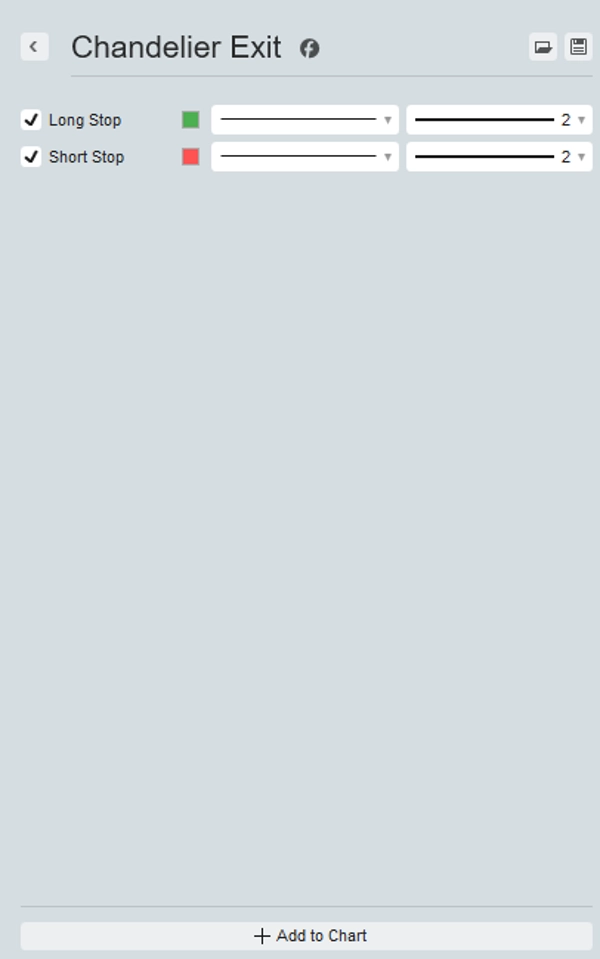
Этот индикатор динамически рассчитывает уровни стоп-лосса на основе максимума и ATR, предоставляя четкие визуальные подсказки на вашем графике в реальном времени.
Созданный, чтобы помочь вам зафиксировать прибыль и защититься от разворотов рынка, Chandelier Exit гарантирует, что вы всегда будете на шаг впереди.
Идеально подходит трейдерам, стремящимся улучшить свою стратегию надежными сигналами выхода, этот индикатор предлагает простой и наглядный подход к управлению рисками. Обновите свой торговый арсенал и защитите свои прибыли с помощью Chandelier Exit.
Сводка
ИИ-сводка
The Chandelier Exit indicator dynamically calculates stop-loss levels based on the highest high price and the Average True Range (ATR). It provides real-time visual cues on trading charts to help traders optimize exit points, lock in profits, and protect against market reversals. Suitable for various markets including Forex, cryptocurrencies, stocks, commodities, and indices, it supports symbols such as BTCUSD, EURUSD, GBPUSD, XAUUSD, NAS100, and USDJPY. The indicator offers a straightforward, visual method for managing risk and enhancing trading strategies by signaling reliable exit points.
Профиль индикатора
Отзывы покупателей
4.3
Отзывы: 3
5 | 33 % | |
4 | 67 % | |
3 | 0 % | |
2 | 0 % | |
1 | 0 % |
Отзывы покупателей
October 9, 2025
Decent tool for testing if the trader wants it keeps trade control closer to the plan. It works best as support, not a final decision maker. The best use is 1 percent risk per trade, BE after 1R and partials near 1.5R. incorrect settings can give a false sense of safety.
October 8, 2025
October 8, 2025
Useful extra check for traders who care about risk before entries. It gives value around risk management, but incorrect settings can give a false sense of safety. I would check 30 trades and compare DD before and after the tool, aiming for less than 3 percent monthly DD. It is useful when the trader already respects stops and sizing.
Обсуждение
Частые вопросы
BTCUSD
Forex
Signal
Indices
EURUSD
Commodities
GBPUSD
NZDUSD
Prop
Scalping
Crypto
Stocks
XAUUSD
NAS100
ATR
USDJPY
Продукты, доступные в cTrader Store, включая торговых ботов, индикаторы и плагины, предоставляются сторонними разработчиками и доступны исключительно в информационных и технических целях. cTrader Store не является брокером и не предоставляет инвестиционные консультации, персональные рекомендации или какие-либо гарантии будущей доходности.


Цена
С 25/09/2025
25
Продажи
315
Бесплатные установки