
Footprint Chart_noSourceCode
Indicatore
1 acquisti
Versione 1.0, Sep 2025
Windows, Mac
4.3
Recensioni: 3
Descrizione
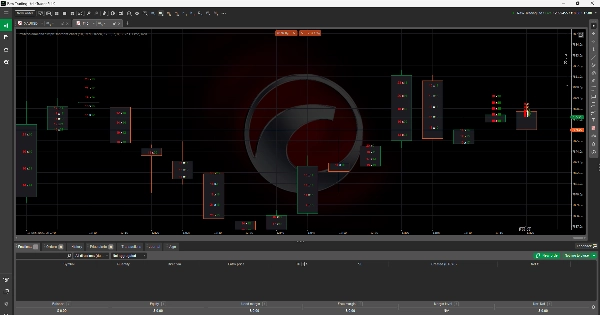
Indicatore del Grafico Footprint
L'Indicatore del Grafico Footprint offre ai trader una vista dettagliata del flusso degli ordini mostrando il volume di domanda e offerta direttamente all'interno di ogni candela di prezzo. A differenza dei grafici a candele tradizionali, questo strumento permette agli utenti di vedere dove la pressione di acquisto e vendita è concentrata a specifici livelli di prezzo. Evidenziando gli squilibri tra acquirenti e venditori, offre approfondimenti più profondi sulla profondità del mercato, la liquidità e l'attività di trading. Questo lo rende uno strumento essenziale per i trader che cercano di perfezionare ingressi, uscite e gestione del rischio attraverso un'analisi avanzata del flusso degli ordini.
Riepilogo
Riepilogo AI
The Footprint Chart Indicator enhances traditional candlestick charts by displaying bid and ask volumes within each price candle. This visualization allows traders to observe buying and selling pressure at specific price levels, revealing imbalances between buyers and sellers. By providing detailed insights into order flow, market depth, liquidity, and trading activity, the indicator supports more precise trade entries, exits, and risk management decisions. It is applicable across various markets including Forex, cryptocurrencies (e.g., BTCUSD), commodities, indices, and stocks. The tool is designed for traders who utilize advanced order flow analysis to refine their strategies.
Profilo indicatore
Recensioni dei clienti
4.3
Recensioni: 3
5 | 67 % | |
4 | 0 % | |
3 | 33 % | |
2 | 0 % | |
1 | 0 % |
Recensioni dei clienti
September 29, 2025
This fits volume based context better as a review layer. The first forward check can be 97 setups on M1, with 20 reactions and manual notes.
September 26, 2025
More useful for someone who wants less noise in the process. The best use is checking participation and pressure, then leaving the final filter manual.
September 23, 2025
I liked it more as a confirmation layer for volume based context than as something to follow blindly. Pressure is easier to read, and the final decision still feels like it belongs to the trader. Light sizing makes the early sample easier to judge.
Discussioni
Domande frequenti
BTCUSD
Forex
Signal
Indices
EURUSD
Commodities
GBPUSD
NZDUSD
Prop
Scalping
Crypto
Stocks
XAUUSD
NAS100
USDJPY
I prodotti disponibili tramite cTrader Store, inclusi bot di trading, indicatori e plugin, sono forniti da sviluppatori terzi e resi disponibili esclusivamente a scopo informativo e di accesso tecnico. cTrader Store non è un broker e non fornisce consulenze in materia di investimento, raccomandazioni individualizzate o garanzie di risultati futuri.
Altro da questo autore


Prezzo
Da 15/01/2025
7
Vendite