

Money Flow Profile
อินดิเคเตอร์
เวอร์ชัน 1.0, Jul 2026
Windows, Mac

534.4M
ปริมาณการเทรด
9.76M
Pips ที่ได้กำไร
4
การขาย
คำอธิบาย
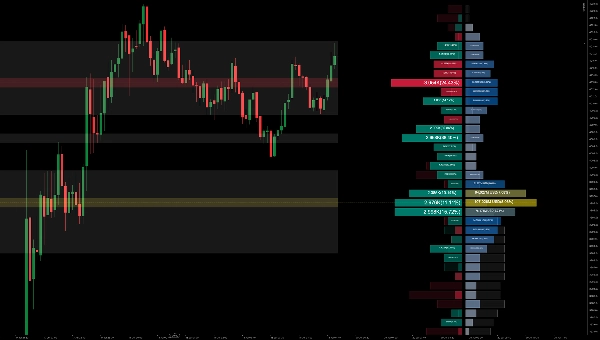
📊 โปรไฟล์กระแสเงิน
โปรไฟล์กระแสเงินเป็นเครื่องมือวิเคราะห์ชั้นสูงที่วัด ปริมาณการซื้อขาย หรือ กระแสเงิน ในทุกระดับราคาบนตลาดในช่วงเวลาที่กำหนด มันเน้นความสัมพันธ์ระหว่างราคาสินทรัพย์กับความเต็มใจของผู้ซื้อขายที่จะซื้อหรือขาย ทำให้คุณสามารถ:
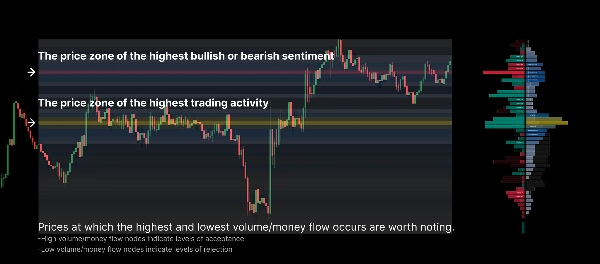
- เปิดเผยระดับราคาสำคัญ: ระบุคลัสเตอร์ปริมาณและโหนดสภาพคล่องสูงได้อย่างง่ายดาย เช่น จุดควบคุม (POC)
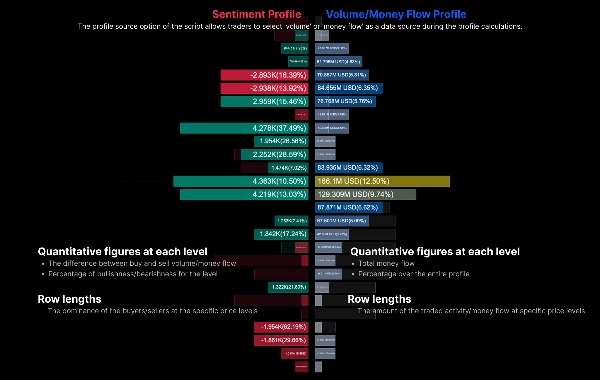
- วิเคราะห์ความรู้สึกตลาด: โดยแสดงโปรไฟล์ความรู้สึกทางซ้ายและโปรไฟล์ปริมาณทางขวา มันจะกำหนดว่าผู้ซื้อหรือผู้ขายกำลังครอบงำในแต่ละระดับราคาที่เฉพาะเจาะจง
- เปรียบเทียบข้ามช่วงเวลา: เปรียบเทียบโปรไฟล์ปัจจุบันโดยตรงกับโปรไฟล์ผีของช่วงเวลาก่อนหน้าเพื่อสังเกตการเปลี่ยนแปลงของจุดศูนย์ถ่วงของตลาด
⚙️ พารามิเตอร์หลัก & คู่มือการใช้งาน
1. การตั้งค่าทั่วไป
- ความยาวย้อนหลัง / ช่วงเวลาคงที่: กำหนดจำนวนแท่งประวัติที่ใช้ในการคำนวณโปรไฟล์ (เช่น แท่งล่าสุด 200 แท่ง)
- แหล่งข้อมูล:
-
1 = ปริมาณ: คำนวณโปรไฟล์โดยอิงจากปริมาณการซื้อขายแบบดั้งเดิม2 = กระแสเงิน: รวมความลึกของราคาเพื่อคำนวณการกระจายกระแสเงิน
2. การตั้งค่าโปรไฟล์
- ความละเอียดแถว (แถว): กำหนดความละเอียดของแกนตั้ง ค่าเลขสูง (เช่น 50-100) จะทำให้โปรไฟล์มีรายละเอียดมากขึ้น
- ความกว้างโปรไฟล์ & การเลื่อนแนวนอน: ปรับความกว้างของโปรไฟล์ที่วาด (เป็นเปอร์เซ็นต์) และระยะเลื่อนไปทางขวา เพื่อป้องกันไม่ให้ทับกับแท่งเทียนปัจจุบัน
3. ความรู้สึก & การแสดงผล
- ขั้วความรู้สึก:
-
1 = แท่งเทียน: กำหนดความรู้สึกกระทิง/หมีโดยอิงจากการเปิดและปิดของแท่งเทียน (ขั้ว)2 = แรงกดดันซื้อ/ขาย: ใช้การคำนวณที่แม่นยำมากขึ้นโดยพิจารณาถึงไส้เทียนและการปิดเมื่อเทียบกับสูง/ต่ำ
- แสดงโปรไฟล์ความรู้สึก / โปรไฟล์ปริมาณ: สวิตช์แยกเพื่อแสดงโปรไฟล์ความรู้สึกสุทธิ (ซ้าย) และโปรไฟล์ปริมาณหลัก (ขวา)
- แสดงช่วงเวลาก่อนหน้า: เมื่อเปิดใช้งาน จะวาดโปรไฟล์ "แท่งผี" เป็นพื้นหลังซึ่งแสดงช่วงเวลาเดียวกันจากช่วงเวลาก่อนหน้า เหมาะสำหรับติดตามการเปลี่ยนแปลงแนวรับ/แนวต้าน
4. การแสดงพื้นที่ขยาย
- แสดงแผนที่ความร้อน: แสดงความหนาแน่นของโปรไฟล์ตลอดช่วงเวลาคำนวณทั้งหมดเป็นแผนที่ความร้อนพื้นหลัง คุณสามารถเลือกแสดง "ปริมาณ" หรือ "ความรู้สึก"
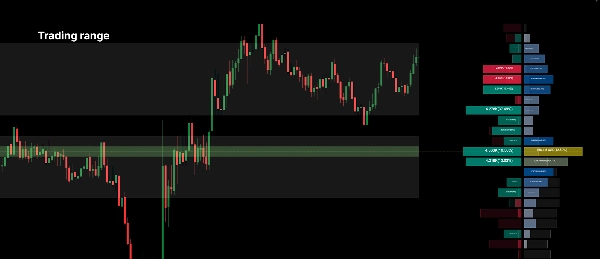
- แสดงพื้นที่มูลค่า: เน้นช่วงราคาหลักที่มีปริมาณการซื้อขายส่วนใหญ่เกิดขึ้น ค่าธรณีประตูสามารถปรับได้ (เช่น 70%)
- แสดงโซน POC: วาดเส้นแนวนอนและโซนอัตโนมัติที่จุดควบคุม (ระดับราคาที่มีปริมาณสูงสุด) สำหรับช่วงเวลาที่เลือก
💡 เคล็ดลับการเทรดที่ใช้งานได้จริง:
- มองหา โหนดปริมาณสูง (ยอด) เพื่อทำหน้าที่เป็นแนวรับหรือแนวต้านที่แข็งแกร่ง
- มองหา โหนดปริมาณต่ำ (หุบเขา) เนื่องจากราคามักเคลื่อนที่อย่างรวดเร็วผ่านโซนสภาพคล่องต่ำเหล่านี้
- ใช้ โปรไฟล์ผีช่วงเวลาก่อนหน้า: หาก POC ปัจจุบัน (เส้นสีเหลือง) กำลังสร้างสูงกว่าจุด POC ของช่วงเวลาก่อนหน้า แสดงว่าความเห็นพ้องเกี่ยวกับมูลค่ากำลังเคลื่อนขึ้น ซึ่งโดยทั่วไปเป็นสัญญาณกระทิง
สรุป
AI summary
Money Flow Profile is an advanced indicator that maps traded volume and market sentiment across price levels over a specified time period. It visualizes the relationship between price and trader activity, highlighting key liquidity zones such as volume clusters and the Point of Control (POC). The tool displays a Sentiment Profile on the left and a Volume Profile on the right, enabling users to assess whether buyers or sellers dominate at each price level. It supports direct comparison with the previous period’s profile via a ghost overlay to track shifts in market value consensus.
Core configurable parameters include lookback length, data source selection (volume or money flow), row resolution for vertical granularity, profile width and offset, and sentiment polarity calculation methods (candle-based or buy/sell pressure). Display options allow toggling of sentiment and volume profiles, previous period overlays, heatmaps of volume or sentiment density, value area highlighting, and automatic POC zone marking.
The indicator is designed to help identify strong support and resistance levels at high volume nodes and anticipate rapid price movements through low volume nodes. It supports detailed volume and sentiment analysis to inform trading decisions based on liquidity and market structure.
Core configurable parameters include lookback length, data source selection (volume or money flow), row resolution for vertical granularity, profile width and offset, and sentiment polarity calculation methods (candle-based or buy/sell pressure). Display options allow toggling of sentiment and volume profiles, previous period overlays, heatmaps of volume or sentiment density, value area highlighting, and automatic POC zone marking.
The indicator is designed to help identify strong support and resistance levels at high volume nodes and anticipate rapid price movements through low volume nodes. It supports detailed volume and sentiment analysis to inform trading decisions based on liquidity and market structure.
โปรไฟล์อินดิเคเตอร์
หมวดหมู่อินดิเคเตอร์
ปริมาณ
ประเภทเอาต์พุต
การแสดงเป็นภาพ
ข้อกำหนดด้านข้อมูล
ปริมาณ
DoM
แท่งเท่านั้น
ข้อมูล Tick
สัญญาณที่รองรับ
Breakout
ความแข็งแกร่งของแนวโน้ม
Reversal
ความผันผวน
แตะ Level ที่ระบุ
เบรก Level ที่ระบุ
รีวิวจากลูกค้า
0.0
รีวิว: 0
รีวิวจากลูกค้า
ยังไม่มีรีวิวสำหรับผลิตภัณฑ์นี้ หากเคยลองแล้ว ขอเชิญมาเป็นคนแรกที่บอกคนอื่น!
การสนทนา
คำถามที่พบบ่อย
Key Levels
Volume
ผลิตภัณฑ์ที่มีให้บริการผ่าน cTrader Store รวมถึงบอทการเทรด อินดิเคเตอร์ และปลั๊กอิน มีให้บริการโดยนักพัฒนาบุคคลที่สามและมีไว้เพื่อวัตถุประสงค์ในการเข้าถึงข้อมูลและทางเทคนิคเท่านั้น cTrader Store ไม่ใช่โบรกเกอร์และไม่ได้ให้คำแนะนำการลงทุน คำแนะนำส่วนบุคคล หรือการรับประกันผลการดำเนินงานในอนาคต
เพิ่มเติมจากผู้เขียนคนนี้




















ราคา
534.4M
ปริมาณการเทรด
9.76M
Pips ที่ได้กำไร
4
การขาย