
Fixed Range Volume Profile
Gösterge
2 satın almalar
Sürüm 1.0, Jan 2026
Windows, Mac
4.0
Değerlendirmeler: 2
Açıklama
Sabit Aralık Hacim Profili (FRVP) Nasıl Kullanılır
- Göstergeleri Etkinleştirin: cTrader Automate veya Göstergeler menüsünden FRVP Göstergesini istediğiniz grafiğe sürükleyip bırakın.
- Analiz Araçlarını Seçin: cTrader araç çubuğunda (genellikle platformun sağ veya sol tarafında) standart Dikdörtgen Çizim Aracını bulun.
- Aralığınızı Tanımlayın: Analiz etmek istediğiniz belirli fiyat hareketi ve zaman dilimi üzerinde dikdörtgeni tıklayıp sürükleyin.
- Profili Başlatın: Çizimden sonra, dikdörtgeni hafifçe tıklayıp hafifçe hareket ettirin. Bu çizim ile gösterge arasındaki "el sıkışma", hacim hesaplamasını tetikler ve anında histogram, POC ve Değer Alanı çizgilerini oluşturur.
- Dinamik Olarak Ayarlayın: Dikdörtgenin kenarlarını sürükleyerek zaman aralığını genişletebilir veya farklı bir fiyat seviyesine taşıyabilirsiniz; hacim profili yeni alanı yansıtacak şekilde otomatik olarak yeniden hesaplanır.
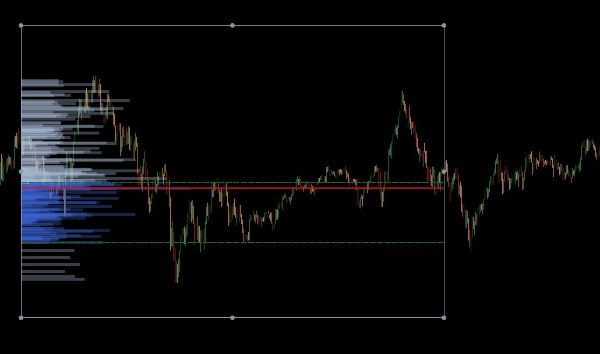
cTrader için Sabit Aralık Hacim Profili (FRVP), belirli bir zaman ve fiyat aralığında hacim dağılımını hesaplayarak önemli fiyat seviyelerini belirlemek için tasarlanmış gelişmiş bir analiz aracıdır. Zamanla ilişkili standart hacim göstergelerinin aksine, bu gösterge piyasa duyarlılığını ortaya çıkarmak için fiyat yoğunluğuna odaklanır.
Temel Özellikler
- Dinamik Aralık Seçimi: Gösterge, cTrader grafiğinizde standart bir dikdörtgen çizdiğinizde veya taşıdığınızda otomatik olarak hesaplar ve günceller.
- Ana Seviye Tanımlaması:
-
- Kontrol Noktası (POC): En yüksek işlem hacmine sahip fiyat seviyesini vurgular ve fiyat hareketi için bir "mıknatıs" görevi görür.
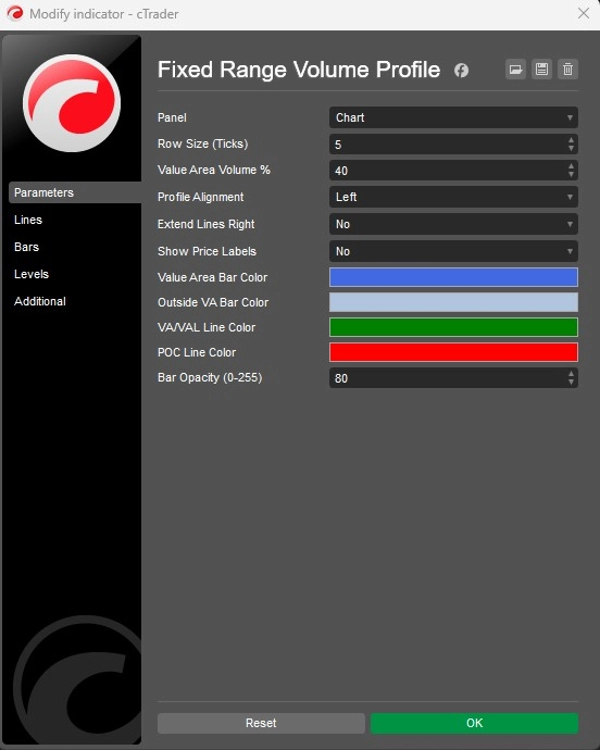
- Değer Alanı Yüksek/Düşük (VAH/VAL): Belirli bir hacim yüzdesinin (varsayılan %40) işlem gördüğü sınırları tanımlar.
- Özelleştirilebilir Düzenler:
-
- Hizalama: Hacim histogramını kutunun Sol veya Sağ tarafında görüntülemeyi seçin.
- Granülerlik: Hacim çubuklarının detayını kontrol etmek için Satır Boyutunu (varsayılan 5 tik) ayarlayın.
- Görseller: Çubuk renkleri (Değer Alanı ve Dışarısı), opaklık ve fiyat etiketi görünürlüğü üzerinde tam kontrol.
Stratejik Uygulama
- Destek ve Direnç: Yüksek Hacimli Düğümler (HVN) genellikle güçlü destek veya direnç olarak işlev görürken, Düşük Hacimli Düğümler (LVN) fiyatın hızlı hareket edebileceği "ince" alanları temsil eder.
- Trend Onayı: Tarihsel hacim seviyelerinin mevcut fiyat hareketiyle nasıl etkileşime girdiğini görmek için Sağa Uzatma özelliğini kullanın.
Özet
YZ özeti
The Fixed Range Volume Profile (FRVP) indicator for cTrader analyzes volume distribution within a user-defined price and time range using a standard rectangle drawing tool. By selecting and adjusting this rectangle on the chart, the indicator dynamically calculates and displays a volume histogram along with key levels: Point of Control (POC), which marks the price with the highest traded volume, and Value Area High/Low (VAH/VAL), defining the volume concentration boundaries. Users can customize the histogram’s alignment, granularity (row size), colors, opacity, and price label visibility. The indicator supports dynamic range adjustments by dragging the rectangle edges, automatically recalculating volume data. Strategically, it helps identify support and resistance zones through high and low volume nodes and offers trend confirmation by extending volume levels into current price action. The FRVP is applicable across various markets including Forex, cryptocurrencies, commodities, indices, and stocks, and supports symbols such as BTCUSD, EURUSD, GBPUSD, XAUUSD, and NAS100. It integrates with cTrader’s drawing tools and provides a detailed volume-based perspective on price action beyond standard time-based volume indicators.
Gösterge profili
Müşteri değerlendirmeleri
4.0
Değerlendirmeler: 2
5 | 0 % | |
4 | 100 % | |
3 | 0 % | |
2 | 0 % | |
1 | 0 % |
Tartışma
SSS
BTCUSD
Forex
Signal
Breakout
Indices
EURUSD
Commodities
GBPUSD
NZDUSD
Fibonacci
Prop
Scalping
Fair Value Gap
SMC
Crypto
Stocks
XAUUSD
NAS100
USDJPY
VWAP
cTrader Store üzerinden erişilebilen işlem botları, göstergeler ve eklentiler gibi ürünler, üçüncü taraf sağlayıcılar tarafından sağlanır ve yalnızca bilgilendirme ve teknik erişim amaçlarıyla sunulur. cTrader Store bir broker değildir ve yatırım tavsiyesi, kişisel öneriler vermez veya gelecekteki performansı garanti etmez.


Fiyat
Başlangıç 26/09/2025
14
Satışlar