
説明
ダーククラウドカバーインジケーターは、市場での潜在的な弱気の反転パターンを特定するために設計されたテクニカル分析ツールです。このパターンは連続する2本のローソク足で構成されます:
- 強気(緑色)のローソク足で、強い買いの勢いを示します。
- 弱気(赤色)のローソク足で、前の終値より上で始まり、前のローソク足の中央値より下で終わることで、売り圧力を示します。
この形成は、市場のセンチメントが変わる可能性を示唆しており、買い手がコントロールを失い、売り手が主導権を握ることを意味します。
特徴と機能:
- パターン検出:
-
- インジケーターはローソク足の価格動作に基づいてダーククラウドカバーパターンをスキャンします。
- 検出されると、トレーダーに警告するためにパターンを視覚的に強調表示します。
- トレンドフィルター(オプション):
-
- 精度を向上させるために、インジケーターには移動平均(MA)を使用したオプショントレンドフィルターが含まれています。
- 有効にすると、パターンは上昇トレンドで発生した場合のみ有効と見なされます。
- 確認ロジック:
-
- インジケーターは次のローソク足をチェックして弱気のシグナルを検証できます。
- 確認ローソク足は、ダーククラウドカバーの安値を下回って終わり、かつ最近のローソク足の平均よりも高いティックボリュームを持つ場合に識別されます。
- これにより、シグナルの信頼性が高まります。
- 視覚的マーカー:
-
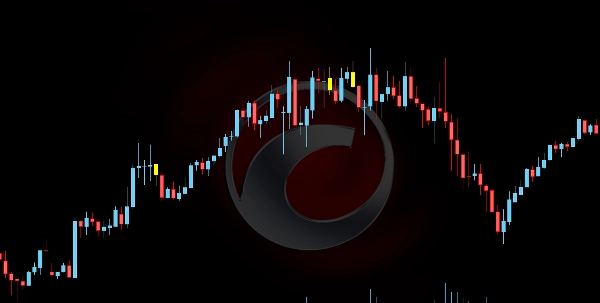
- 黄色のローソク足: 検出されたダーククラウドカバーパターンを示します。
- オレンジ色のローソク足: ボリューム条件が満たされた場合に確認ローソク足を強調表示します。
このインジケーターは、トレーダーが高確率の反転セットアップを見つけるのに役立ち、ショートエントリーやリスク管理戦略の意思決定を改善します。
概要
AIによる概要
The Dark Cloud Cover indicator is a technical analysis tool that identifies a specific bearish reversal candlestick pattern. This pattern consists of two candles: a bullish (green) candle indicating strong buying momentum, followed by a bearish (red) candle that opens above the previous close but closes below the midpoint of the prior candle, signaling selling pressure and a potential shift from buyers to sellers.
Key features include:
- **Pattern Detection:** Automatically scans for the Dark Cloud Cover pattern based on candlestick price action and visually highlights detected patterns for trader awareness.
- **Optional Trend Filter:** Incorporates a Moving Average (MA) filter to validate patterns only during uptrends, enhancing signal accuracy.
- **Confirmation Logic:** Validates bearish signals by analyzing the subsequent candle, which must close below the pattern’s low with higher-than-average tick volume to confirm the reversal.
- **Visual Markers:** Uses yellow candles to mark detected patterns and orange candles to highlight confirmation candles meeting volume criteria.
This indicator assists traders in recognizing high-probability bearish reversal setups, supporting decision-making for short entries and risk management strategies.
インジケーターのプロフィール
カスタマーレビュー
0.0
レビュー: 0
カスタマーレビュー
この商品にはまだレビューがありません。お使いになったことがある方は、ぜひレビューをお願いします。
ディスカッション
よくあるご質問
Signal
cTrader Storeで入手可能な取引ボット、インジケーター、プラグインなどの商品は、第三者の開発者が提供するものであり、情報と技術の取得のみを目的としてご利用いただけます。cTrader Storeはブローカーではなく、投資助言や個人的な推奨を行うことも、将来のパフォーマンスを保証することもありません。
この作成者の他の商品


これも好きかも
![「[Stellar Strategies] Smart ADX」ロゴ](https://cdn.ctrader.com/image/webp/af13b084-b6f6-41db-b7bc-c7e688b57b05_36929)


価格
5
販売
435
無料インストール