

説明
smaカラー
概要
AIによる概要
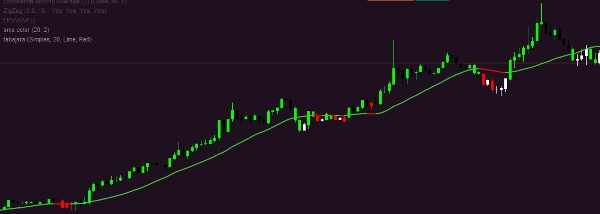
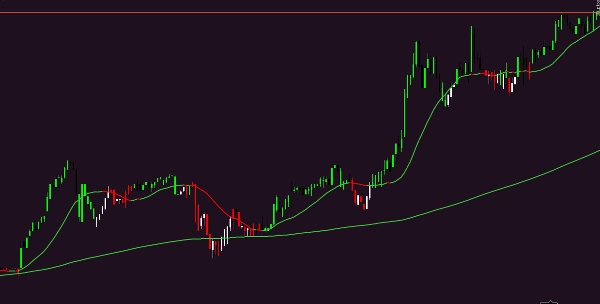
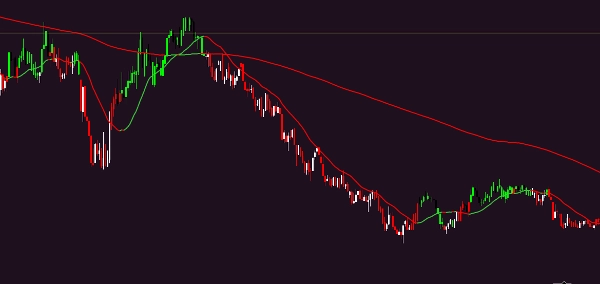
The "sma color" indicator is a technical analysis tool designed to display a simple moving average (SMA) with color differentiation. It visually represents the SMA line on trading charts, potentially using color changes to indicate different market conditions or trends. This indicator aids traders in identifying trend direction and momentum by smoothing price data over a specified period. It is compatible with various trading instruments and timeframes, providing a clear and straightforward way to analyze price movements.
インジケーターのプロフィール
カスタマーレビュー
0.0
レビュー: 0
カスタマーレビュー
この商品にはまだレビューがありません。お使いになったことがある方は、ぜひレビューをお願いします。
ディスカッション
よくあるご質問
cTrader Storeで入手可能な取引ボット、インジケーター、プラグインなどの商品は、第三者の開発者が提供するものであり、情報と技術の取得のみを目的としてご利用いただけます。cTrader Storeはブローカーではなく、投資助言や個人的な推奨を行うことも、将来のパフォーマンスを保証することもありません。
この作成者の他の商品


![「Tabajara corrigido[fix]」ロゴ](https://cdn.ctrader.com/image/webp/7f4bbef8-b245-4ebd-80d7-582fffc0c90c_28378)


価格
登録日 10/02/2025
1.26K
無料インストール