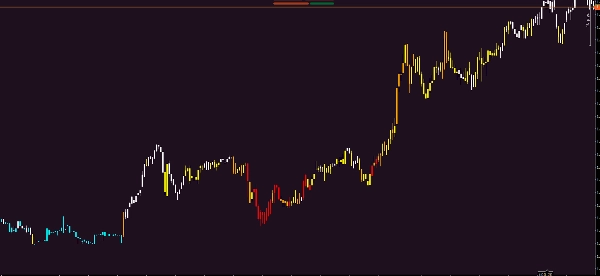
「HeatMap Candle」ロゴ
HeatMap Candle
「HeatMap Candle」アップロード画像
登録日 10/02/2025
1.05K
無料インストール

HeatMap Candle

Indicator profile
0.0
レビュー: 0
カスタマーレビュー
この商品にはまだレビューがありません。お使いになったことがある方は、ぜひレビューをお願いします。
Products available through cTrader Store, including trading bots, indicators and plugins, are provided by third-party developers and made available for informational and technical access purposes only. cTrader Store is not a broker and does not provide investment advice, personal recommendations or any guarantee of future performance.

この作成者の他の商品

VWAP Tabajara
sma color
Larry Williams 9.1
HTFOverlayPlus
corrigido todos os bugs e cores invertidas tabajara antigo deleetado
price quote

これも好きかも

PDHL - Previous Day High&Low
The Dynamic Refined RSI smooths traditional RSI signals, improving accuracy and reducing market noise.
「VWAP Pro」ロゴ
5.0
(4)
無料
Advanced VWAP with up to 30 anchored levels, multiple timeframes, memory mode, standard deviation bands & simple GUI
Lightweight utility indicator designed to preload and persist custom colors in cTrader’s “Recent Colors” list.
[Hamster-Coder] Pivot Points (Demo)
DXY HMA Indicator
Daily TPO profile indicator that calculates POC, VAH and VAL for each session. Plots the Point of Control and the 70% Va
سيد قيصر ال مجيد
📊 Smart Floating Risk Pro – Advanced Risk Management for cTrader
Dynamic Liquidity Depth exposes hidden volume
Automatically plots Fibonacci retracement levels using the highest and lowest points of a customizable time range
A powerful RSI-based hunter that detects early reversals and snipes market turning points with high accuracy.
media movil de 35,50 y 200
L'indicatore UTBot è uno strumento di analisi tecnica che crea una linea di trailing stop dinamica basata sull'ATRT
Belkhayate PRC (Polynomial Regression Channel)
Multi-timeframe ATR, smart swap calculator, range analysis all in one professional panel.
Non-repainting Fractal + ZigZag indicator with smart filtering. True market structure. No future function, no drift.
A cutting-edge indicator designed to detect and visualize high-probability zones based on swing highs, swing lows.
登録日 10/02/2025
1.05K
無料インストール