
説明
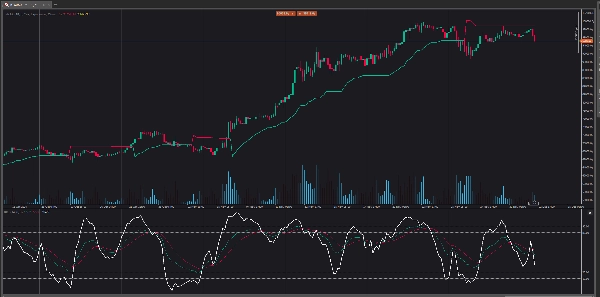
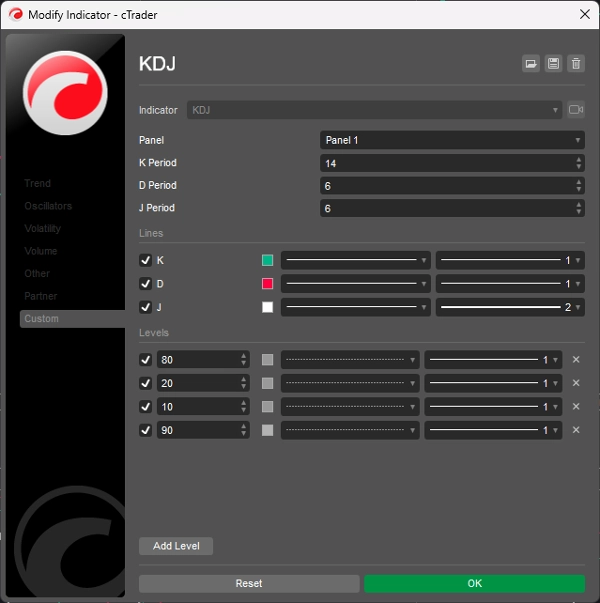
KDJオシレーターの表示は3本の線(K、D、J - これが表示名の由来です)と2つのレベルで構成されています。KとDはストキャスティクスオシレーターを使用する際の同じ線です。J線はD値がK値からどれだけ逸脱しているかを表します。これらの線の収束は新しい取引機会を示します。ストキャスティクスオシレーターと同様に、売られ過ぎおよび買われ過ぎのレベルはトレンドが反転しやすい時期に対応しています。
概要
インジケーターのプロフィール
カスタマーレビュー
5.0
レビュー: 1
5 | 100 % | |
4 | 0 % | |
3 | 0 % | |
2 | 0 % | |
1 | 0 % |
カスタマーレビュー
August 18, 2025
Pros: Three-line stochastic oscillator (K, D, J) that identifies overbought/oversold levels and momentum shifts. Supports divergence analysis and crossovers between K and D as trading signals. Lightweight and responsive. Cons: No alerts, tooltips, or settings presets. J‑line can generate outlier v
ディスカッション
よくあるご質問
cTrader Storeで入手可能な取引ボット、インジケーター、プラグインなどの商品は、第三者の開発者が提供するものであり、情報と技術の取得のみを目的としてご利用いただけます。cTrader Storeはブローカーではなく、投資助言や個人的な推奨を行うことも、将来のパフォーマンスを保証することもありません。


これも好きかも


価格
2
販売
6.89K
無料インストール