present
Regístrese y obtenga 50 $ de descuento en su primera compra
Trading product for AW Multi Data Indicador, image 1
AW Multi Data
5.62K
Instalaciones gratis

Descripción

Resumen

Resumen de IA
AW Multi Data is a trading indicator that displays key trading metrics directly on your chart. It shows the current symbol and timeframe, daily net profit percentage, daily net profit amount, and spread. The indicator requires the timezone to be set to UTC to accurately reflect daily profit values. This tool provides real-time performance data to assist traders in monitoring their trades within the charting interface.
Perfil del indicador

Conversación

Valoraciones de clientes

0.0
Valoraciones: 0
Valoraciones de clientes
Este producto todavía no se ha valorado. ¿Ya lo ha probado? Sea el primero en informar a otros.

Preguntas frecuentes

Los productos disponibles a través de cTrader Store, incluidos bots, indicadores y plugins para operar, son proporcionados por desarrolladores de terceros y están disponibles únicamente con fines informativos y de acceso técnico. cTrader Store no es un bróker, por lo que no proporciona asesoramiento de inversión, recomendaciones personales ni ninguna garantía de rentabilidad futura.

Más de este autor

Logotipo de "IR Candle MTF"
4.6
(6)
Gratis
with this indicator you could see other time frame candle in your chart.
show spread on chart
some user add moving average to macd to see better. in ctrader 4.3.11 there is a problem with this . I make a macd tha
this indicator show macd on chart.
Multi Time Frame Moving Average is a powerful and flexible indicator for cTrader
 this moving include everything that a trader needs from Moving Average.
this indicaotr show distance between Tenkan to Kijun, Close to Kijun and Close to Tenkan 
Add Slowing to IR Moving Average.
IR Candle Open plots customizable opening price lines for daily, weekly, and monthly candles
Coral indicator
you could put your check list in your chart you could split your test with “,” you could put your checklist in indicat
this indicator show other time frame close in lower time frame. for ex: show daily close in m 15.

Puede interesarle

Volume distribution analysis with Market Profile TPO integration.
Smart Money Gaps: MTF FVG auto-detection, extension, and mitigation marker. Trade institutional imbalances.
The cTrader Market Sessions Alerts Indicator marks global sessions, highlights key levels, and sends real-time alerts.
Identify potential reversal points in the market by detecting candles with exceptionally long upper or lower wicks
Angora Pattern Recognition is a cTrader indicator that finds, draws and tracks classic chart patterns automatically.
Logotipo de "PivotLevels"
4.7
(4)
$25
/
$30
It draws Pivot Levels on the chart.
Multi-symbol, multi-timeframe Fair Value Gaps in one panel.
EMA-cross signals scored on six confluence layers, with an ATR stop, three targets and a live panel
Super Trend Rsi ,ATR + trend change distance + dynamic Alpha, divergence/convergence
The Linear Regression Oscillator (LRO) is a technical indicator based on linear regression analysis.
Trend direction, chart signals, reversal zones and volume tools in one configurable indicator.
Trend analysis, automatic analysis, position, swingtrader, scalper
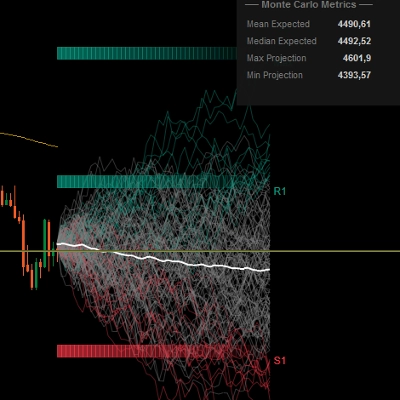
Predictive Monte Carlo Engine Forecast future price paths using institutional-grade statistical models and probability
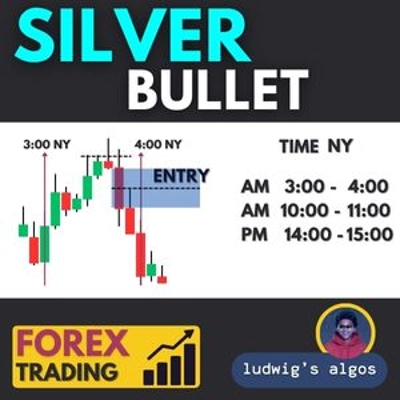
Silver Bullet by LudwigICT
Smart Money Concepts (SMC) indicator with real-time Fair Value Gap (FVG) boxes, $50 round numbers, and live market HUD.
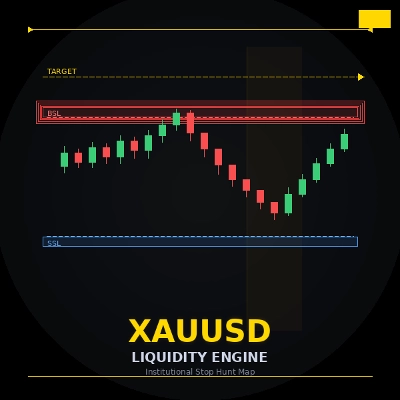
ICT liquidity engine for Gold: maps stop clusters, scores zones & projects the next target. Now with 4 ICT killzones.
Pinpoint FVGs, track fills and see mitigation stats — trade imbalances with clarity and confidence.
An advanced VWAP with multi-VWAP (Daily/Weekly/Monthly/Anchored), click-to-anchor, configurable alerts, a stats panel,

Precio

5.62K
Instalaciones gratis