
Descripción
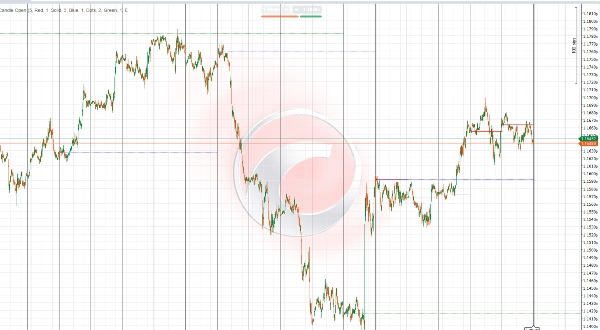
Indicador IR Candle Open es una herramienta versátil y personalizable que traza los precios de apertura de las velas semanales, diarias y mensuales en su gráfico de trading. Los traders pueden seleccionar el número de períodos (días, semanas, meses) para mostrar, permitiendo un análisis multitemporal flexible adaptado a su estrategia.
Las características clave incluyen:
- Trazado preciso de las aperturas de las velas para números definidos por el usuario de períodos diarios, semanales y mensuales.
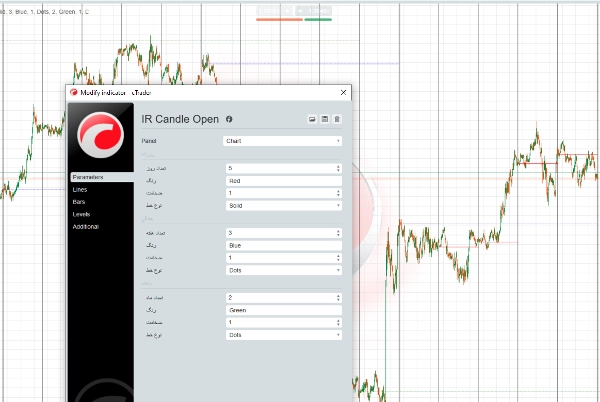
- Estilos de línea personalizables: los usuarios pueden elegir el tipo de línea (sólida, discontinua, punteada), color y grosor para una mejor legibilidad del gráfico.
- Soporta visualización multitemporal para ayudar a identificar niveles de precio importantes a través de diferentes horizontes temporales.
- Ayuda a detectar posibles zonas de soporte y resistencia basadas en estos precios críticos de apertura.
- Compatible con varios mercados como Forex, materias primas, índices y criptomonedas.
Esta flexibilidad permite a los traders adaptar la visualización del indicador a sus preferencias personales y estilo de trading, mejorando la claridad y facilitando la toma de decisiones basada en niveles de precio cruciales.
توضیح فارسی (بهروز شده)
اندیکاتور IR Candle Open ابزاری منعطف و قابل تنظیم است که قیمتهای باز شدن کندلهای هفتگی، روزانه و ماهیانه را روی نمودار معاملاتی شما نمایش میدهد. کاربران میتوانند تعداد دورههای روزانه، هفتگی و ماهیانه که میخواهند خطوط آنها نمایش داده شود را انتخاب کنند تا تحلیل چندتایمفریمی متناسب با سبک معاملاتی خود داشته باشند.
ویژگیهای کلیدی:
- نمایش دقیق خطوط قیمت باز شدن کندلها برای تعداد دورههای دلخواه در تایمفریمهای روزانه، هفتگی و ماهیانه.
- امکان انتخاب نوع خط (ساده، خطچین، نقطهچین)، رنگ و ضخامت خطوط برای بهبود وضوح و خوانایی نمودار.
- پشتیبانی از تحلیل چندتایمفریمی جهت شناسایی سطوح مهم قیمتی در بازههای زمانی مختلف.
- کمک به تشخیص سطوح حمایت و مقاومت احتمالی بر اساس این نقاط کلیدی باز شدن قیمتها.
- مناسب برای استفاده در بازارهای مختلف مانند فارکس، کالاها، شاخصها و رمزارزها.
این قابلیتها به تریدرها امکان میدهد تا نمایش اندیکاتور را بر اساس سلیقه و سبک معاملاتی خود تنظیم کنند و با وضوح بیشتر، تصمیمات بهتری بگیرند.
Resumen
Valoraciones de clientes
5 | 100 % | |
4 | 0 % | |
3 | 0 % | |
2 | 0 % | |
1 | 0 % |


