
Descripción
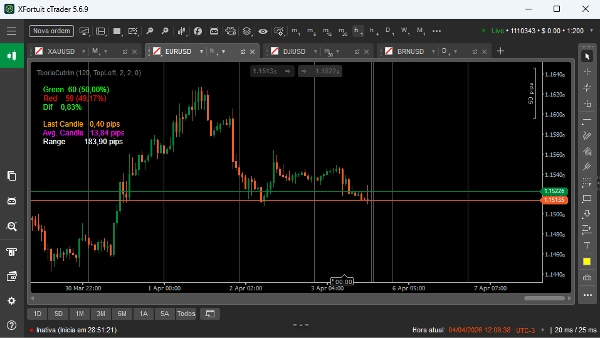
TeoriaCutrim es un indicador estadístico superpuesto diseñado para cuantificar el comportamiento reciente del mercado mediante el análisis de la distribución de velas y la volatilidad. En lugar de predecir la dirección, proporciona datos objetivos sobre lo que el mercado acaba de hacer dentro de una ventana configurable de velas.
Datos del mercado analizados
El indicador evalúa un número definido por el usuario de velas recientes (período de retroceso) y extrae:
- Número y porcentaje de velas alcistas (cierre > apertura)
- Número y porcentaje de velas bajistas (cierre < apertura)
- Diferencia entre dominancia alcista y bajista
- Rango promedio de la vela (en pips)
- Rango de la vela actual (en pips)
- Rango total de precios en la ventana analizada
Salida visual e interpretación
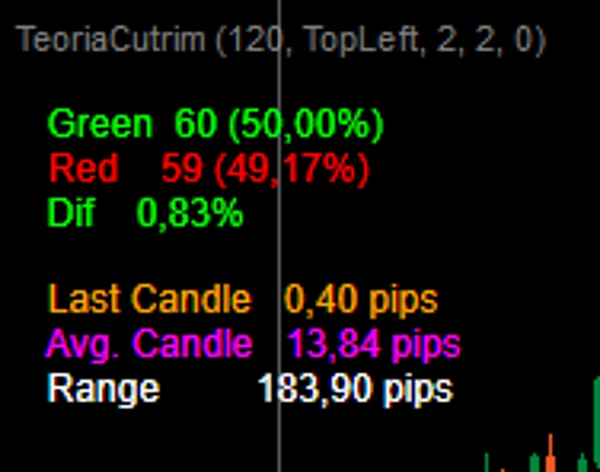
El indicador muestra métricas clave directamente en el gráfico:
- Verde: total de velas alcistas y porcentaje
- Rojo: total de velas bajistas y porcentaje
- Dif: diferencia absoluta entre porcentajes alcistas y bajistas
- Última vela: tamaño actual de la vela en pips
- Vela promedio: tamaño promedio de las velas en la ventana seleccionada
- Rango: distancia entre el máximo más alto y el mínimo más bajo en la ventana
La interpretación es sencilla:
- Un mayor número de velas alcistas sugiere presión alcista reciente
- Un mayor número de velas bajistas sugiere presión bajista reciente
- Una diferencia baja (Dif) indica equilibrio o aleatoriedad
- El aumento del tamaño promedio de las velas indica una volatilidad en expansión
- Un rango total grande sugiere expansión del mercado, mientras que un rango pequeño sugiere compresión
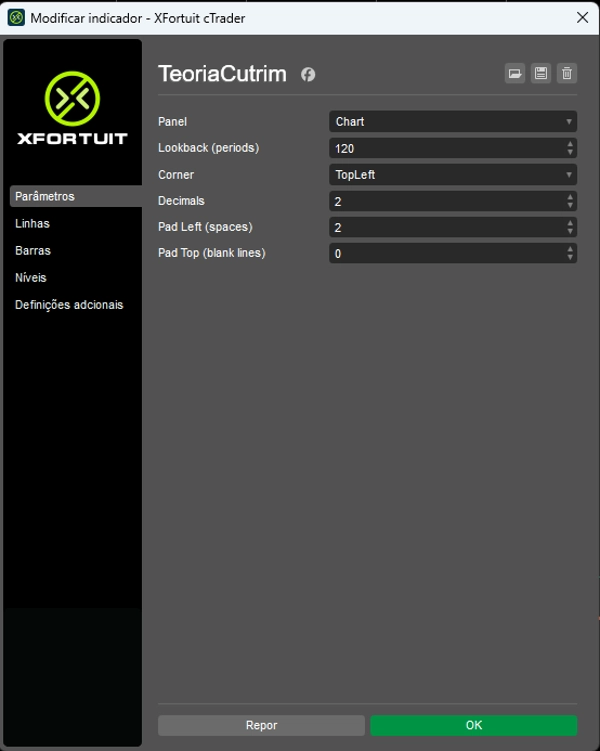
Parámetros clave
- Lookback: número de velas usadas para el análisis (totalmente ajustable)
- Corner: posición en pantalla de la visualización de datos
- Decimales: número de decimales mostrados
- Pad Left / Pad Top: ajustes de espaciado visual
Casos de uso
TeoriaCutrim se usa mejor como una herramienta de contexto, no como un generador de señales. Las aplicaciones típicas incluyen:
- Medir el desequilibrio estadístico antes de entrar en operaciones
- Identificar expansión o contracción de la volatilidad
- Filtrar operaciones basadas en el comportamiento reciente de las velas
- Apoyar estrategias cuantitativas o basadas en probabilidades
Usuario objetivo
Este indicador está diseñado para traders que se basan en datos, estadísticas y análisis objetivos en lugar de reconocimiento subjetivo de patrones. Adecuado tanto para traders discrecionales como sistemáticos.


