present
Đăng ký và nhận ưu đãi $50 cho lần mua đầu tiên
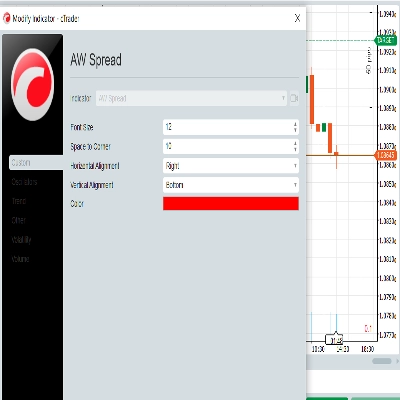
Trading product for IR Spread Chỉ báo, image 1
IR Spread
5.0
Đánh giá: 2
5.66K
Cài đặt miễn phí

Mô tả

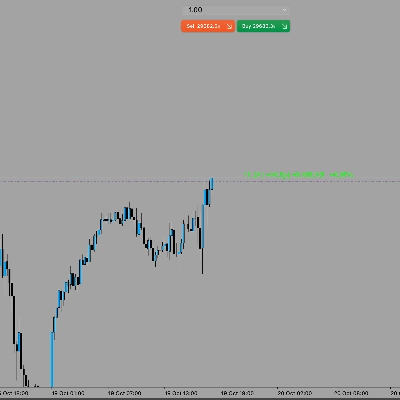
hiển thị spread khi cập nhật biểu đồ

Kênh Telegram hỗ trợ chúng tôi để có thêm nhiều chỉ báo và bot miễn phí hơn

Tóm tắt

Tóm tắt AI
IR Spread is a trading indicator designed to display the spread directly on the chart during updates. It provides real-time visualization of the spread, helping traders monitor this key metric within their trading platform interface. The indicator integrates seamlessly with chart updates, ensuring that spread information is current and easily accessible.
Hồ sơ chỉ báo

Thảo luận

Đánh giá của khách hàng

5.0
Đánh giá: 2
5
100 %
4
0 %
3
0 %
2
0 %
1
0 %
Đánh giá của khách hàng
June 4, 2026
didn't check deep enough so far but it seems perfect and smooth
November 18, 2025

Câu hỏi thường gặp

Các sản phẩm có sẵn trên cTrader Store, bao gồm bot giao dịch, chỉ báo và plugin, được cung cấp bởi các nhà phát triển bên thứ ba và chỉ nhằm mục đích cung cấp thông tin và tiếp cận kỹ thuật. cTrader Store không phải là nhà môi giới và không cung cấp lời khuyên đầu tư, khuyến nghị cá nhân hay bất kỳ đảm bảo nào về hiệu suất trong tương lai.

Sản phẩm khác của tác giả này
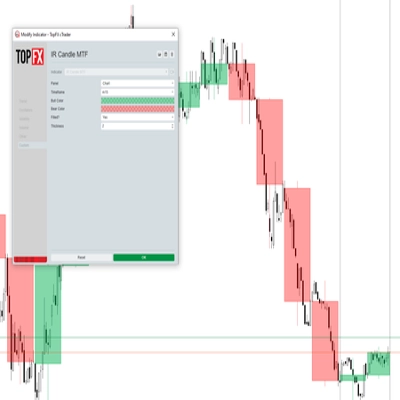
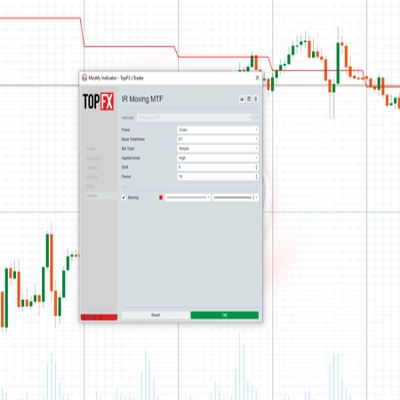
with this indicator you could see other time frame candle in your chart.
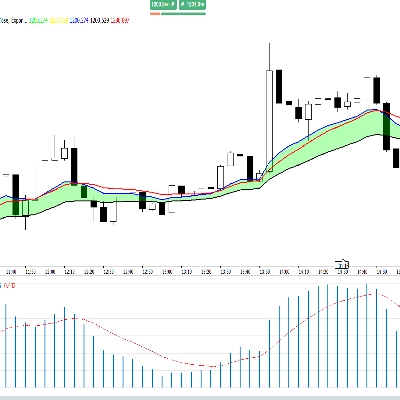
some user add moving average to macd to see better. in ctrader 4.3.11 there is a problem with this . I make a macd tha
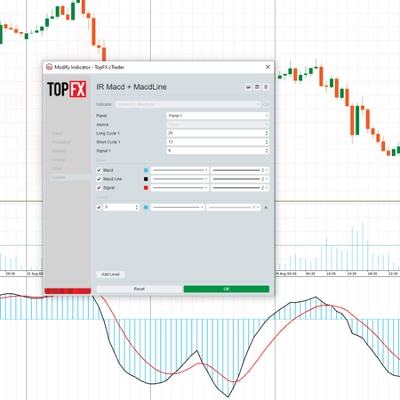
this indicator show macd on chart.
Multi Time Frame Moving Average is a powerful and flexible indicator for cTrader
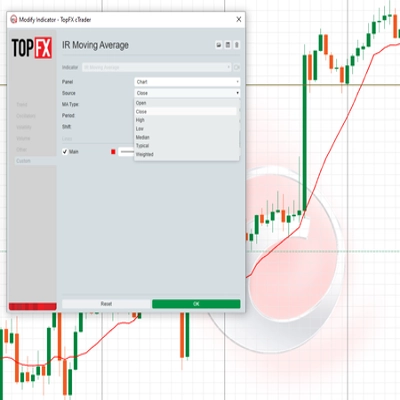
 this moving include everything that a trader needs from Moving Average.
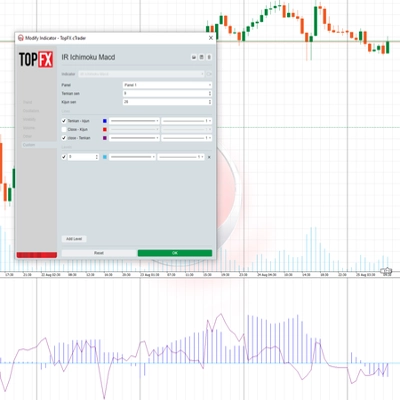
this indicaotr show distance between Tenkan to Kijun, Close to Kijun and Close to Tenkan 
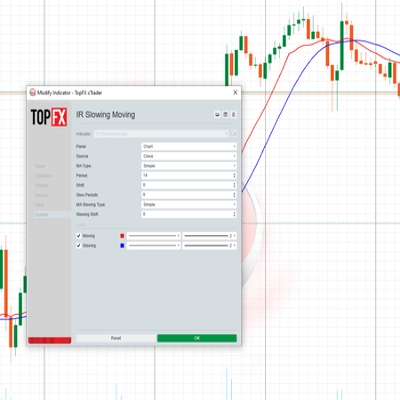
Add Slowing to IR Moving Average.
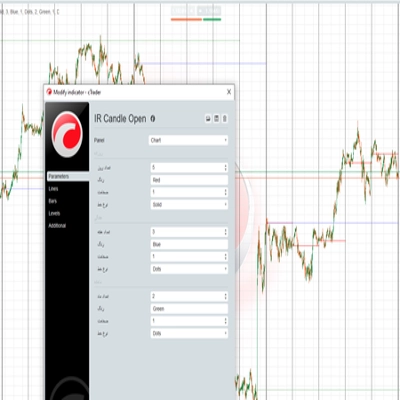
IR Candle Open plots customizable opening price lines for daily, weekly, and monthly candles
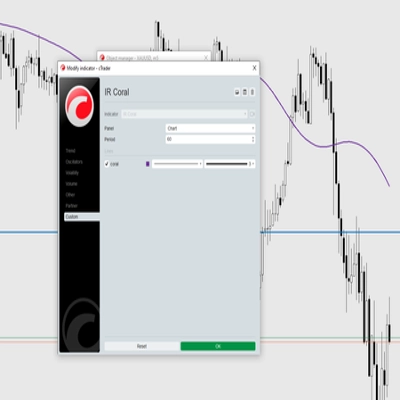
Coral indicator
you could put your check list in your chart you could split your test with “,” you could put your checklist in indicat
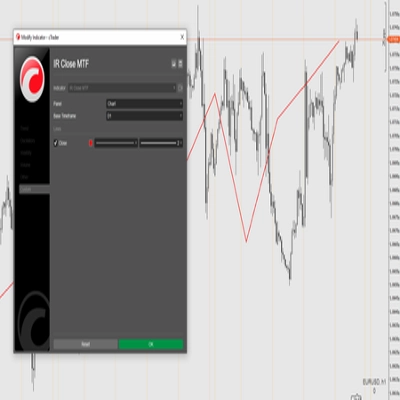
this indicator show other time frame close in lower time frame. for ex: show daily close in m 15.
don't move to the end of chart after timeframe changing. it should be better to use for near history. for long history

Bạn cũng có thể thích

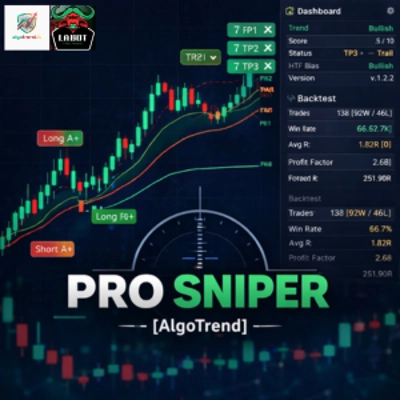
Market structure signals graded A to C, each with a drawn trade plan, plus an adaptive trend ribbon and a trend matrix
MultiTF Pivot and SR Indicator
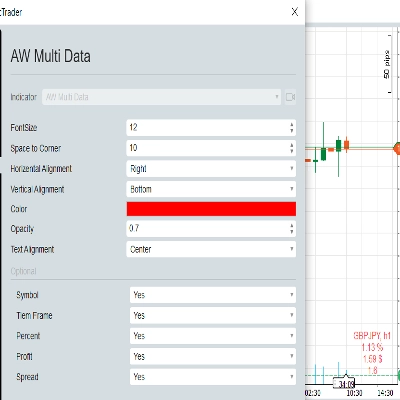
Customizable corner watermark — display symbol, timeframe, broker, or a live candle countdown without cluttering chart
Auto Fibonacci Retracement Indicator for cTrader
One of the best indicators we have ever developed, with a very high profit ratio.
Pro Structure & Candlestick Patterns Detector
MMXM Structure by LudwigICT – Professional Market Structure Mapping Tool
🚀 Automated Elliott Wave & Fibonacci tool for cTrader. Spot trends, corrections & retracements fast.
10 Factors. One Signal. Zero Guesswork.
Logo "IVB 2.0"
4.6
(5)
$19
IVB 2.0 is an indicator that works on the strategy of imbalance of the maximum volatility box of indices
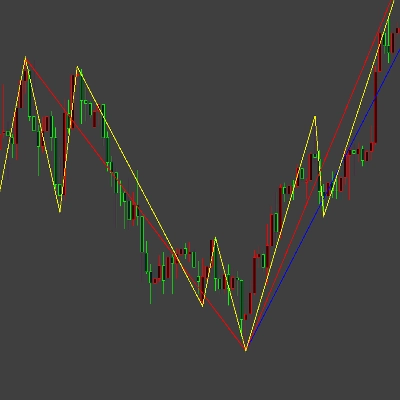
Three ZigZag lines
The Volume Delta Indicator using Institutional Level 2 DOM Data, The Edge Institutions Pay Millions For, now on cTrader
Custom ADX Indicator for precise trend analysis. المؤشر المخصص ADX لتحليل الاتجاه بدقة
Candle timer with live profit tracking on chart – displays pips, currency value, and percentage in real time.
Supply and demand zone detection from swing pivots, with H4 multi-timeframe confluence and volume filtering.
Opening ranges, dynamic trend channels, and multi-scale breakout/retest analysis for clear intraday chart decisions.
Logo "RSI Advanced"
5.0
(4)
$20
/
$30
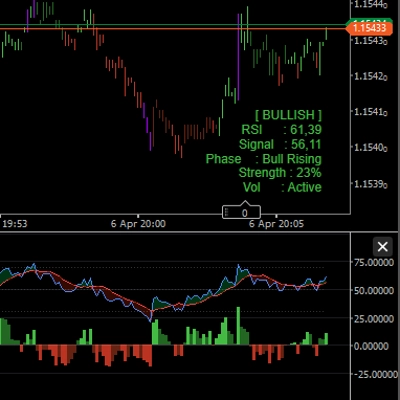
The standard Relative Strength Index (RSI), RSI & Signal Cloud, Smart Volatility Filter (ATR), On-Chart Info Dashboard
Angora Pattern Recognition is a cTrader indicator that finds, draws and tracks classic chart patterns automatically.

Giá

5.66K
Cài đặt miễn phí