present
Registrati e ricevi uno sconto da $50 sul tuo primo acquisto
Trading product for IR Coral Indicatore, image 1
IR Coral
5.0
Recensioni: 1
5.66K
Installazioni gratuite

Descrizione

Indicatore di corallo


Riepilogo

Riepilogo AI
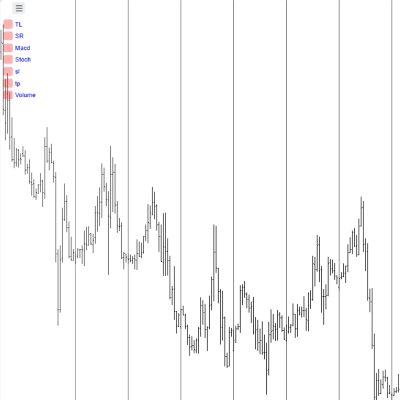
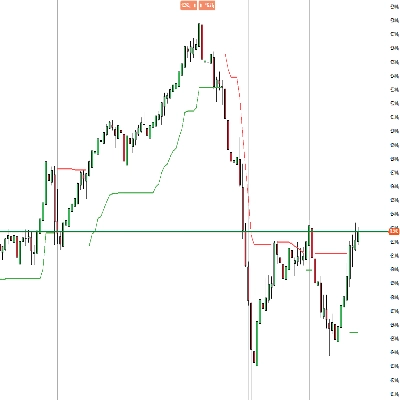
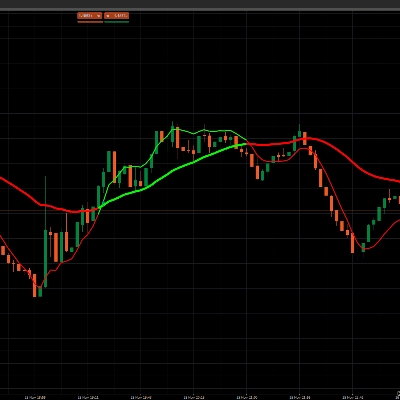
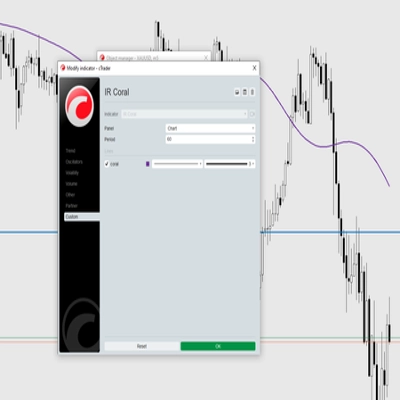
IR Coral is a technical indicator designed for use in trading platforms. It provides analytical insights based on market data to assist traders in making informed decisions. The product functions as a standalone indicator without specified trading strategies, timeframes, or market symbols. It does not include built-in risk management parameters or position sizing guidelines. IR Coral is intended for integration within trading interfaces to enhance market analysis through its indicator outputs.
Profilo indicatore

Discussioni

Recensioni dei clienti

5.0
Recensioni: 1
5
100 %
4
0 %
3
0 %
2
0 %
1
0 %
Recensioni dei clienti
August 2, 2025

Domande frequenti

I prodotti disponibili tramite cTrader Store, inclusi bot di trading, indicatori e plugin, sono forniti da sviluppatori terzi e resi disponibili esclusivamente a scopo informativo e di accesso tecnico. cTrader Store non è un broker e non fornisce consulenze in materia di investimento, raccomandazioni individualizzate o garanzie di risultati futuri.

Altro da questo autore
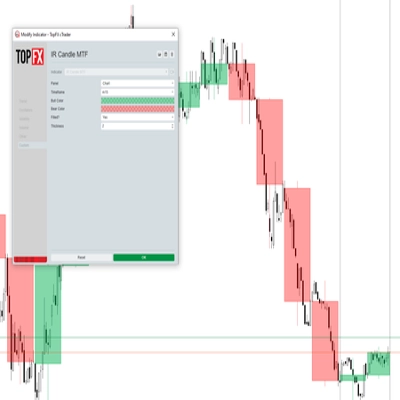
with this indicator you could see other time frame candle in your chart.
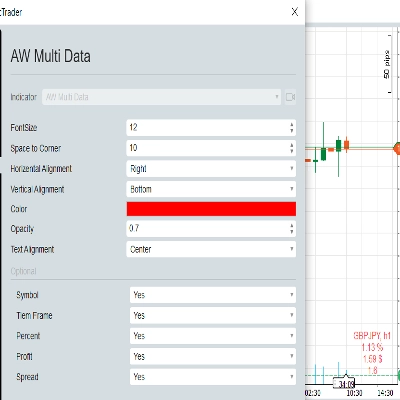
show spread on chart
some user add moving average to macd to see better. in ctrader 4.3.11 there is a problem with this . I make a macd tha
this indicator show macd on chart.
Multi Time Frame Moving Average is a powerful and flexible indicator for cTrader
 this moving include everything that a trader needs from Moving Average.
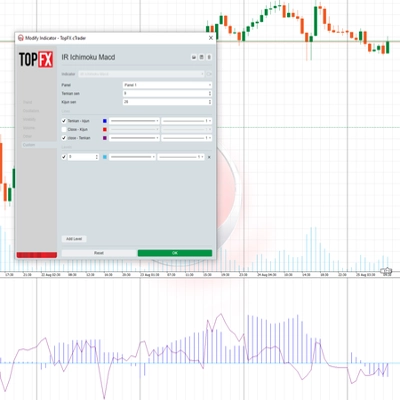
this indicaotr show distance between Tenkan to Kijun, Close to Kijun and Close to Tenkan 
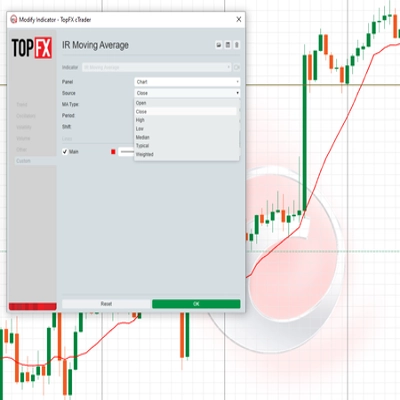
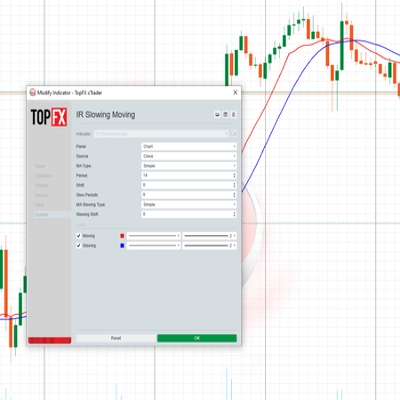
Add Slowing to IR Moving Average.
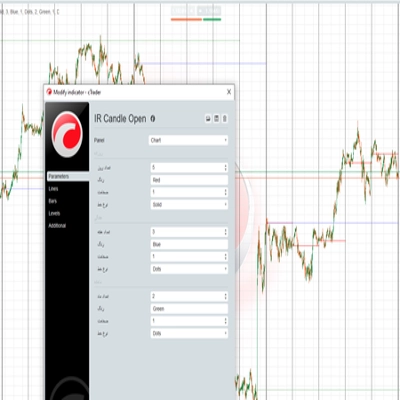
IR Candle Open plots customizable opening price lines for daily, weekly, and monthly candles
you could put your check list in your chart you could split your test with “,” you could put your checklist in indicat
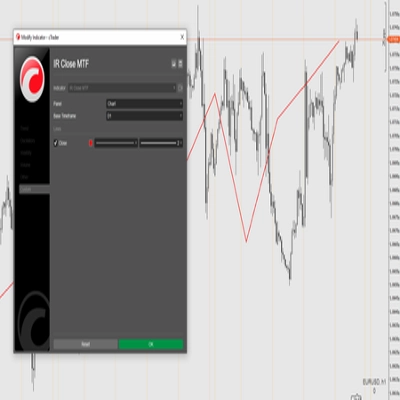
this indicator show other time frame close in lower time frame. for ex: show daily close in m 15.
don't move to the end of chart after timeframe changing. it should be better to use for near history. for long history

Potrebbe interessarti anche
Detect FVGs with age, status, Fibonacci levels, and customizable fill threshold—extended version.
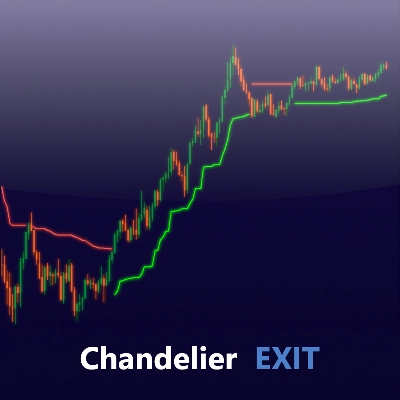
Optimize exits with Chandelier Exit! Visualize stop-loss points dynamically for improved trading precision and safety.
FlexSR auto‑detects pivot highs/lows to plot dynamic support & resistance lines Features customizable styling and option
Bollinger Bands Advanced Squeeze & Breakout System, Real-Time On-Chart Dashboard, Auto-Squeeze Detector, Dual-Band Cloud
Catch High-Probability Reversals with Precision Swing
Pivot Point with base zone daily Asia-London-New york Session.
GOLD SENTINEL v1.0 - A CANDLE-COLORING INDICATOR FOR GOLD.
Identifies institutional zones with Volume Delta (K) across any asset or chart for high-precision entry detection.
Volume Meter
Trading.FC$_vwap Algo shows VWAP trends, dynamic support/resistance and deviation bands to spot potential trade entries.
😎Read the description before purchasing💩
Compare up to 27 symbols across eight timeframes with seven analysis engines and an interactive cTrader dashboard.
Optimize exits with Chandelier Exit! Visualize stop-loss points dynamically for improved trading precision and safety.
Logo di "crossover 1"
4.2
(5)
$19
/
$29
Crossover Buy and Sell Alerts and signals
📊 Smart Floating Risk Pro – Advanced Risk Management for cTrader
VWAP Bands indicator with 3 standard deviation levels, buy/sell zones, and a draggable ON/OFF button to toggle the entir
Feather Gauge – Forex Sentiment Indicator The Feather Gauge is a visual sentiment indicator designed to represent marke
Upgrade to ATR-RMA! Experience the precise ATR using Relative Moving Average for accurate volatility analysis in cTrader

Prezzo

5.66K
Installazioni gratuite