Descrizione
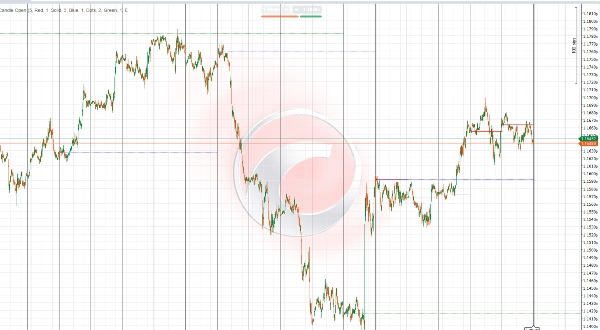
Indicatore IR Candle Open è uno strumento versatile e personalizzabile che traccia i prezzi di apertura delle candele settimanali, giornaliere e mensili sul tuo grafico di trading. I trader possono selezionare il numero di periodi (giorni, settimane, mesi) da visualizzare, consentendo un'analisi multi-timeframe flessibile adattata alla loro strategia.
Le caratteristiche principali includono:
- Tracciamento preciso delle aperture delle candele per un numero definito dall'utente di periodi giornalieri, settimanali e mensili.
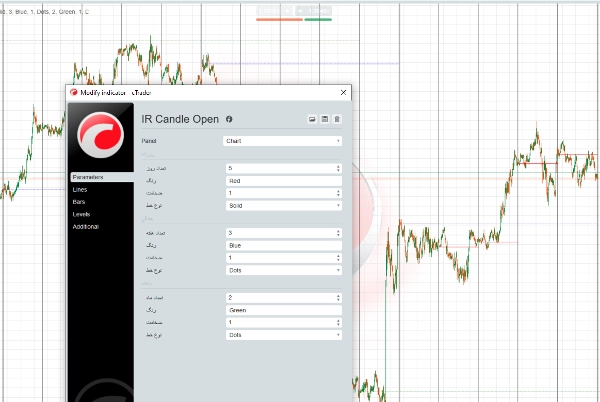
- Stili di linea personalizzabili: gli utenti possono scegliere il tipo di linea (solida, tratteggiata, puntinata), il colore e lo spessore per una migliore leggibilità del grafico.
- Supporta la visualizzazione multi-timeframe per aiutare a identificare livelli di prezzo importanti su diversi orizzonti temporali.
- Aiuta a individuare potenziali zone di supporto e resistenza basate su questi prezzi di apertura critici.
- Compatibile con vari mercati come Forex, materie prime, indici e criptovalute.
Questa flessibilità permette ai trader di adattare la visualizzazione dell'indicatore alle loro preferenze personali e allo stile di trading, migliorando la chiarezza e facilitando decisioni basate su livelli di prezzo cruciali.
توضیح فارسی (بهروز شده)
اندیکاتور IR Candle Open ابزاری منعطف و قابل تنظیم است که قیمتهای باز شدن کندلهای هفتگی، روزانه و ماهیانه را روی نمودار معاملاتی شما نمایش میدهد. کاربران میتوانند تعداد دورههای روزانه، هفتگی و ماهیانه که میخواهند خطوط آنها نمایش داده شود را انتخاب کنند تا تحلیل چندتایمفریمی متناسب با سبک معاملاتی خود داشته باشند.
ویژگیهای کلیدی:
- نمایش دقیق خطوط قیمت باز شدن کندلها برای تعداد دورههای دلخواه در تایمفریمهای روزانه، هفتگی و ماهیانه.
- امکان انتخاب نوع خط (ساده، خطچین، نقطهچین)، رنگ و ضخامت خطوط برای بهبود وضوح و خوانایی نمودار.
- پشتیبانی از تحلیل چندتایمفریمی جهت شناسایی سطوح مهم قیمتی در بازههای زمانی مختلف.
- کمک به تشخیص سطوح حمایت و مقاومت احتمالی بر اساس این نقاط کلیدی باز شدن قیمتها.
- مناسب برای استفاده در بازارهای مختلف مانند فارکس، کالاها، شاخصها و رمزارزها.
این قابلیتها به تریدرها امکان میدهد تا نمایش اندیکاتور را بر اساس سلیقه و سبک معاملاتی خود تنظیم کنند و با وضوح بیشتر، تصمیمات بهتری بگیرند.
Riepilogo
Recensioni dei clienti
5 | 100 % | |
4 | 0 % | |
3 | 0 % | |
2 | 0 % | |
1 | 0 % |