
Descripción
TREND ANALYSIS es un indicador técnico avanzado para la plataforma cTrader que combina múltiples enfoques analíticos en una sola solución. Desarrollado para traders que buscan confirmación de tendencia mediante la convergencia de indicadores, ofrece una vista completa del mercado con señales precisas y filtros de validación.
¡MIRA EL VIDEO INTRODUCTORIO SOBRE LA ESTRATEGIA OPERATIVA!
🎯 ESTRATEGIAS DE USO
1. Trading de Seguimiento de Tendencia
Aplicación: Identificar y seguir tendencias establecidas
Marco temporal: H4, D1 para posiciones más largas
Configuraciones: ADX > 25, Volumen por encima del promedio
Gestión de Riesgos: Stop-loss por debajo de la media móvil de 50 períodos
2. Swing Trading
Aplicación: Capturar movimientos a medio plazo
Marco temporal: H1, H4
Configuraciones: Filtro de volumen activado, confirmación por Perfil de Volumen
Objetivos: POC del Perfil de Volumen como TP
3. Trading de Rupturas
Aplicación: Entrar en rupturas de soporte/resistencia
Configuraciones: Volumen PVA para confirmar la fuerza del movimiento
Confirmación: ADX en aumento + Volumen por encima del promedio
4. Scalping (Marcos Temporales Más Cortos)
Aplicación: Operaciones rápidas con múltiples confirmaciones
Marco temporal: M1, M5
Configuraciones: Filtros estrictos de volumen y Momentum
🔧 CÓMO FUNCIONAN LOS INDICADORES
NUCLEO ADX & DI
ADX (Índice Direccional Promedio)
Función: Medir la fuerza de la tendencia
Interpretación:
0-25: Tendencia débil/movimiento lateral
25-50: Tendencia fuerte
50+: Tendencia muy fuerte
Uso Práctico: Evitar operaciones cuando ADX < 20
+DI / -DI (Indicadores Direccionales)
+DI: Fuerza del comprador
-DI: Fuerza del vendedor
Señal: Cruce de +DI por encima de -DI (compra) y viceversa
Pendiente ADX (Pendiente ADX)
Función: Medir la aceleración de la tendencia
Representación: Histograma cian
Señal: Valores positivos indican una tendencia en fortalecimiento
FILTROS DE VOLUMEN
Filtro MA de Volumen
Función: Validar señales con volumen por encima del promedio
Parámetros: Periodo 20, Multiplicador 1.0
Uso: Confirmación del interés institucional
Volumen PVA (Análisis de Precio y Volumen)
Colores y Significado:
Verde: Compra con volumen muy alto (>150% del promedio)
Azul: Compra con volumen alto
Rojo: Venta con volumen muy alto
Rosa: Venta con volumen alto
Amarillo: Pin Bar/Agotamiento con ruptura de soporte
PERFIL DE VOLUMEN
POC (Punto de Control)
Función: Precio con el mayor volumen negociado
Uso: Objetivo natural para operaciones, soporte/resistencia dinámico
Área de Valor
Función: Zona donde se negoció el 70% del volumen
Interpretación:
Precio arriba: Tendencia alcista
Precio abajo: Tendencia bajista
Dentro: Posible movimiento lateral
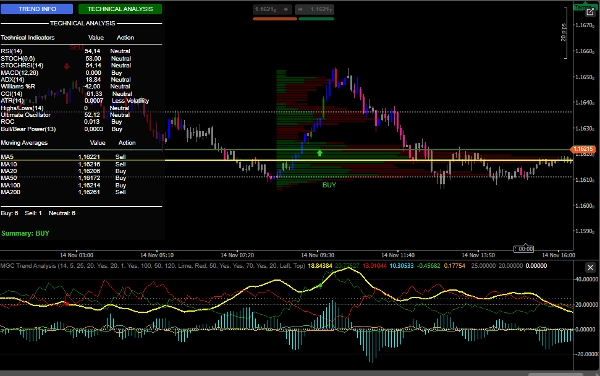
ANÁLISIS TÉCNICO COMPLETO
Panel de Indicadores
RSI: Sobreventa (<30) / Sobrecompra (>70)
MACD: Momentum
Williams %R: Condiciones Extremas
CCI: Identificación de Reversiones
Estocástico: Momentum a corto plazo
Oscilador Ultimate: Momentum multi-marco temporal
Medias Móviles
Conjunto completo de MAs (5, 10, 20, 50, 100, 200)
Análisis de alineación para la tendencia
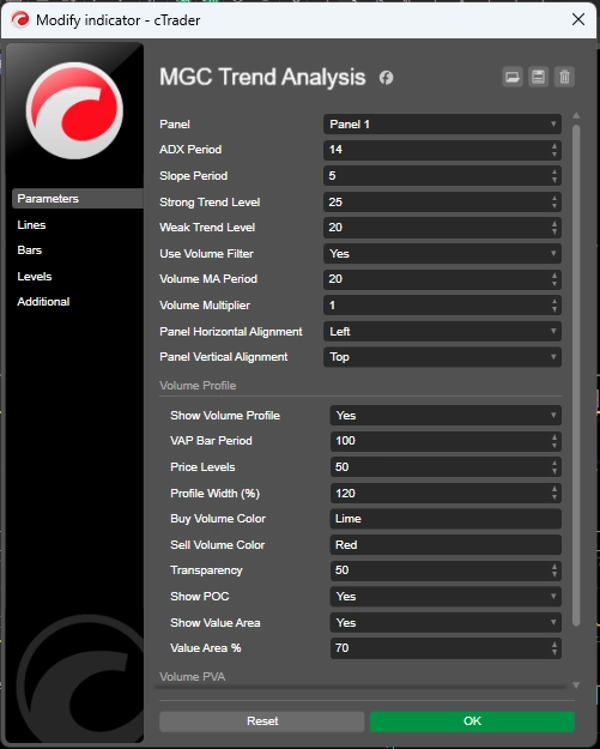
⚙️ CONFIGURACIONES RECOMENDADAS
Configuración Conservadora
javascript
Periodo ADX: 14
Periodo de Pendiente: 5
Nivel de Tendencia Fuerte: 25
Nivel de Tendencia Débil: 20
Usar Filtro de Volumen: true
Periodo MA de Volumen: 20
Multiplicador de Volumen: 1.2
Configuración Agresiva
javascript
Periodo ADX: 10
Periodo de Pendiente: 3
Nivel de Tendencia Fuerte: 20
Nivel de Tendencia Débil: 15
Usar Filtro de Volumen: true
Periodo MA de Volumen: 14
Multiplicador de Volumen: 1.0
Perfil de Volumen (Recomendado)
javascript
Mostrar Perfil de Volumen: true
Periodo de Barra VAP: 100
Niveles de Precio: 50
% Área de Valor: 70
Mostrar POC: true
🎨 RECURSOS VISUALES
Interfaz de Usuario
Panel Dinámico: Información en tiempo real
Botones Interactivos: Cambiar entre análisis
Colores Intuitivos: Codificación basada en función
Señales Gráficas
Flechas: entradas de COMPRA/VENTA
Sonidos: alertas audibles
Colores de Barra: análisis PVA integrado
Resumen
Key components include the Average Directional Index (ADX) and Directional Indicators (+DI, -DI) to measure trend strength and direction, with ADX slope indicating trend acceleration. Volume filters such as Volume Moving Average and Price Volume Analysis (PVA) validate signals by confirming institutional interest and trade strength. The Volume Profile feature highlights the Point of Control (POC) and Value Area, aiding in identifying dynamic support/resistance and trend conditions.
Additional technical tools integrated in the indicator panel include RSI, MACD, Williams %R, CCI, Stochastic, Ultimate Oscillator, and multiple moving averages (5 to 200 periods) for momentum, reversal, and trend alignment analysis. The user interface offers a dynamic panel with real-time data, interactive controls, color-coded signals, graphical BUY/SELL arrows, audible alerts, and bar coloring based on PVA analysis.
Recommended settings are provided for both conservative and aggressive trading styles, with adjustable ADX periods, slope periods, volume filters, and volume profile parameters.
Valoraciones de clientes
5 | 67 % | |
4 | 33 % | |
3 | 0 % | |
2 | 0 % | |
1 | 0 % |


![Logotipo de "Smart Money Concepts (SMC) [Iridio Capital]"](https://cdn.ctrader.com/image/webp/28b69fd1-ef54-4bed-9487-07e78e883be4_40934)


