
Description
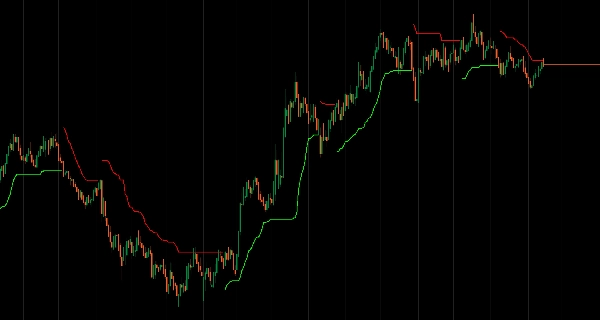
Stops suiveurs adaptatifs à la volatilité qui s'ajustent automatiquement aux conditions du marché.
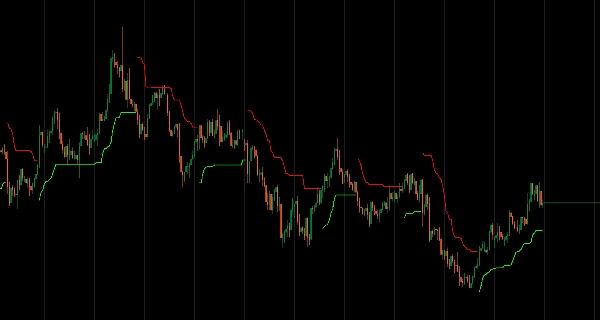
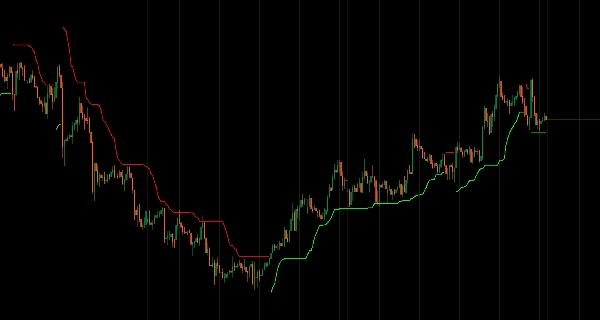
Élargit la largeur du stop suiveur lors des pics de volatilité et la resserre dans les marchés calmes en utilisant une mesure basée sur l'ATR, évitant ainsi les sorties prématurées dans les marchés en tendance tout en maintenant la proximité pendant la consolidation.
Adaptation intelligente à la volatilité avec recalcul en temps réel, détection de régime avec logique de confirmation pour filtrer les faux signaux, mémoire de tendance incorporant l'élan directionnel pour une marge de manœuvre lors de mouvements forts, trois composants adaptatifs (Volatility Stretch, Trend Boost, Regime Confirmation), types de MA personnalisables et paramètres de sensibilité, et affichage visuel clair à un seul stop suiveur offrant une gestion dynamique des stops pour les traders ciblant des tendances durables avec une conscience structurelle.
CARACTÉRISTIQUES
Adaptation intelligente à la volatilité
- Ajuste automatiquement la largeur du stop suiveur en utilisant une mesure de volatilité basée sur l'ATR
- Élargit les stops lorsque la volatilité actuelle dépasse la moyenne
- Resserre dans les marchés calmes pour des stops plus proches
- S'adapte en temps réel aux conditions changeantes du marché
Détection de régime
- Identifie les tendances haussières/baissières avec une logique de confirmation
- Filtre les faux signaux et réduit les oscillations erratiques
- Nécessite un nombre spécifié de barres pour confirmer les retournements de tendance
- Identification claire de la tendance sans bruit
Mémoire de tendance
- Incorpore l'élan directionnel pour élargir les stops lors de fortes tendances
- Ajoute une marge de manœuvre lors de mouvements directionnels puissants
- Prévient les sorties prématurées dans les marchés en tendance
- Respecte la structure du marché plutôt que des distances arbitraires
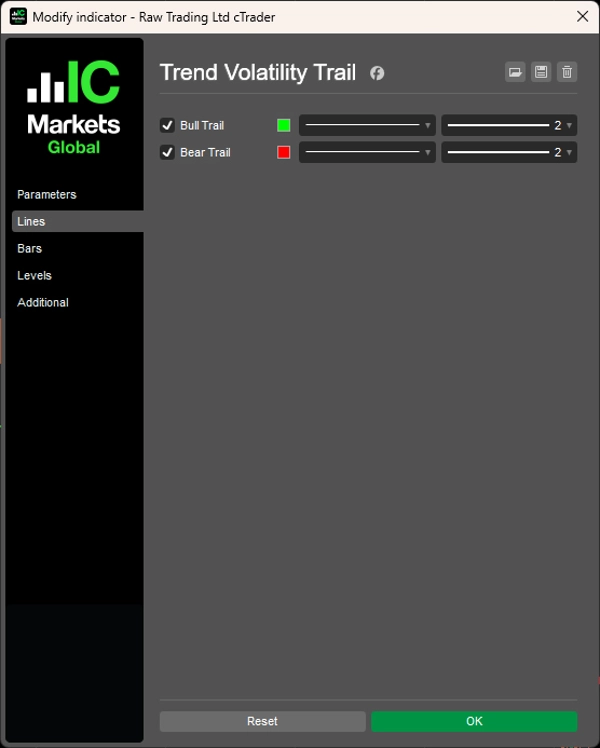
Affichage visuel clair
- Affiche uniquement le stop suiveur actif (haussier ou baissier)
- Présentation du graphique épurée
- Confirmation visuelle claire de la tendance
- Facile à lire d'un coup d'œil
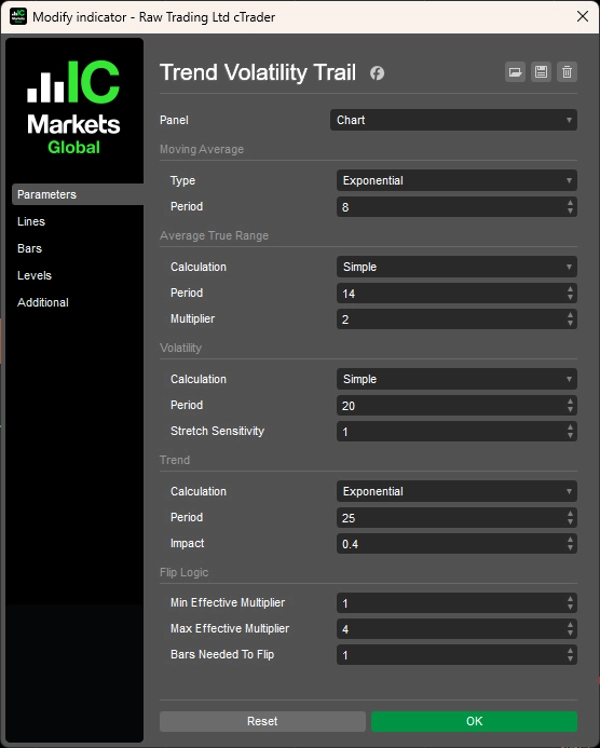
Hautement personnalisable
- Contrôle total sur les types de MA
- Paramètres de sensibilité ajustables
- Exigences de confirmation configurables
- Affinez pour correspondre à votre style de trading
Trois composants adaptatifs
- Volatility Stretch : Élargit les stops lors des pics de volatilité
- Trend Boost : Ajoute de la marge lors de mouvements forts
- Regime Confirmation : Valide les changements de tendance
Le concept et la méthodologie originaux sont adaptés de l'indicateur "Trend Following Volatility Trail" par HDAlgos.
__________________________________________________________________________________________
PLUS D'INDICATEURS GRATUITS
Explorez une large gamme d'outils d'analyse de marché — de la structure et du volume à la régression, la volatilité et les périodes personnalisées.
Le code source est disponible sur le dépôt GitHub.
Tous gratuits à utiliser. Mais si vous souhaitez offrir un café en soutien, vous pouvez le faire ici.
Support/Résistance
Volume
- Profileur d'Activité de Volume
- Analyseur d'Efficacité du Volume
- Analyse du Profil de Volume
- Profil de Volume - Mis à jour
- Analyse de la Répartition du Volume
- VWAP (Prix Moyen Pondéré par le Volume)
Moyennes Mobiles
- Canal SSL
- Moyenne Mobile Ancrée
- Moyenne Mobile Échelonnée par Écart
- Activateur Haut Bas de Gann
- Ligne de Tendance Instantanée
- MA Adaptative de Kaufman avec Vision de Tendance
- Canal de Moyenne Mobile
- Suite de Moyennes Mobiles
- Moyenne Mobile du Canal de Tendance
Utilitaires/Personnalisés
Basé sur la Régression
Volatilité
Oscillateurs
__________________________________________________________________________________________
AVERTISSEMENT
Le trading comporte des risques. Cet indicateur est destiné uniquement à l'analyse technique — appliquez toujours une gestion des risques appropriée et tradez de manière responsable.
RETROACTION & AMÉLIORATIONS
Si vous avez des suggestions, des demandes de fonctionnalités ou des idées d'amélioration, veuillez laisser un commentaire dans l'onglet Discussion. Vos retours aident à améliorer l'indicateur pour tous.
Résumé
Key features include real-time volatility adaptation, regime detection with confirmation logic to identify bull and bear trends and filter false signals, and trend memory that incorporates directional momentum to provide additional room during strong moves. The indicator combines three adaptive components—Volatility Stretch, Trend Boost, and Regime Confirmation—to deliver structurally aware stop management.
The visual display is streamlined, showing only the active trail (bull or bear) for clear trend confirmation without chart clutter. Users can customize moving average types, sensitivity parameters, and confirmation requirements to tailor the indicator to their trading style.
This indicator supports traders targeting sustained trends by providing dynamic, market-responsive trailing stops that respect market structure and volatility changes. It is intended for technical analysis and includes a disclaimer advising responsible trading and risk management.


