
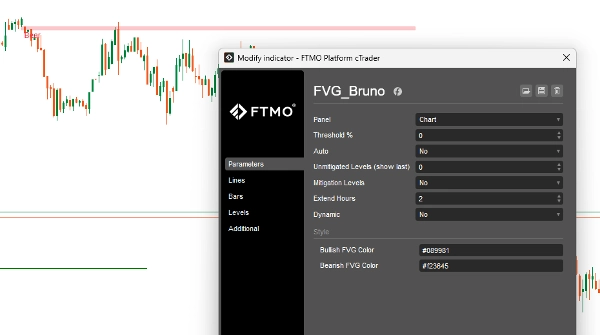
FVG_Bruno
Indicateur
Version 1.0, Oct 2025
Windows, Mac
4.0
Avis : 2
Description
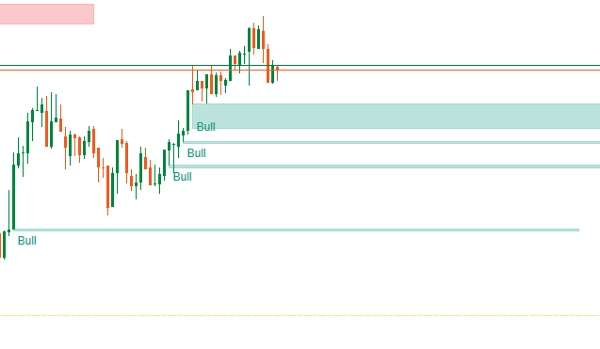
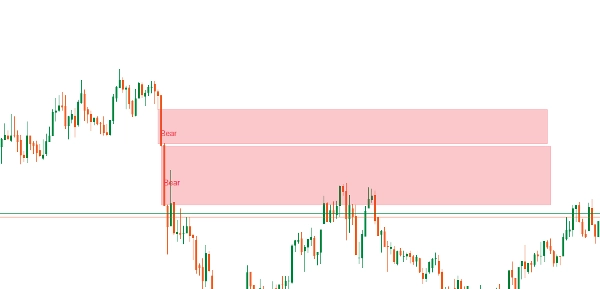
Un FVG est un déséquilibre de prix qui se produit lorsque le marché évolue de manière agressive dans une direction, laissant un écart entre des chandeliers consécutifs. Cet écart représente une zone où la liquidité n'a pas été entièrement échangée, et le prix y revient souvent plus tard pour « combler » ce déséquilibre.
Par exemple :
- Lors d’un mouvement haussier, si la Bougie 1 se ferme et que la Bougie 3 s’ouvre bien au-dessus du plus haut de la Bougie 1, laissant le plus bas de la Bougie 2 non testé, cet écart est un FVG.
- Les traders s’attendent à ce que le prix retrace cet écart avant de poursuivre la tendance.
Résumé
Profil de l'indicateur
Avis clients
4.0
Avis : 2
5 | 0 % | |
4 | 100 % | |
3 | 0 % | |
2 | 0 % | |
1 | 0 % |
Discussion
Questions fréquentes
BTCUSD
Forex
Signal
Indices
EURUSD
Commodities
GBPUSD
NZDUSD
Prop
Fair Value Gap
Crypto
Stocks
XAUUSD
NAS100
USDJPY
Les produits disponibles sur cTrader Store, notamment les bots de trading, les indicateurs et les plug-ins, sont fournis par des développeurs tiers et mis à disposition à titre informatif et à des fins d'accès technique uniquement. cTrader Store n'est pas un courtier et ne fournit aucun conseil en investissement, aucune recommandation personnelle ni aucune garantie quant aux performances futures.
Plus de cet auteur


![Logo de "Smart Money Concepts (SMC) [Iridio Capital]"](https://cdn.ctrader.com/image/webp/28b69fd1-ef54-4bed-9487-07e78e883be4_40934)


Prix
Depuis le 22/10/2025
303.42M
Volume tradé
49
Pips gagnés
1
Ventes