説明
Pinescriptlabs ストアインジケーター: 🤖Pinescriptlabs ストア cBots : (cBot) Gold & BTC ブレイクアウトセッションピボット(新着)
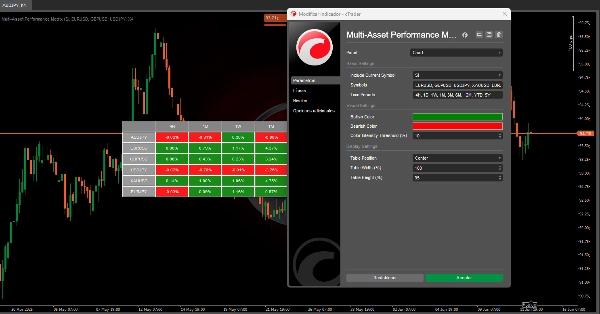
🚀 マルチアセットパフォーマンスマトリックス 🚀
このアルゴリズムは 強力な視覚ツール 📊 で、異なる期間にわたる複数の金融商品群の パフォーマンスの割合を表示するよう設計されています。
過去のデータを 効率的かつ直感的な可視化に変換し、ユーザーがさまざまな金融資産の動向を迅速に評価できるようにします。
❓ このツールは何をするの?
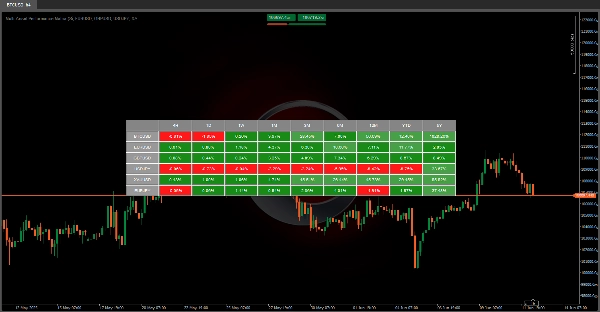
1️⃣ 📈 資産を比較:BTCUSD、EURUSD、XAUUSDなどの異なる金融商品の価格が時間とともにどのように変化したかを示します。
- 時間軸: D(日次) | 1W(週次) | 1M(月次) | 3M(四半期) | 6M(半年) | 12M(年次) | YTD(年初来) | 5Y(過去5年)
2️⃣ 🎨 トレンドを強調:色分け(🟢, 🔴)を使用して、各期間でどの資産が上昇または下降しているかを瞬時に識別します。
3️⃣ ⏱️ 自動更新:最新の市場情報を反映するためにデータを 毎分更新します。
💡 なぜこれが役立つの?
✔ 📊 比較分析:複数の資産を並べて比較でき、ポートフォリオ管理や時間軸に基づくトップパフォーマーの選択に最適です。
✔ 🛡️ コントロール:異なる期間にわたる資産の一貫性(またはボラティリティ)を評価することで、関連するリスクを把握できます。
✨ キー
✅ ⏳ 時間節約:このデータを手動で収集・計算するには何時間もかかりますが、このツールは瞬時に行います!
✅ 👀 視覚的に明確:色分けされたシステムにより、非技術的なユーザーでも分析が簡単です。
✅ 🔄 適応可能:カスタムシンボルをサポートしているため、自分にとって重要な資産を追跡できます。
概要
カスタマーレビュー
5 | 100 % | |
4 | 0 % | |
3 | 0 % | |
2 | 0 % | |
1 | 0 % |